

Competitive Market
Palo Alto, CA
Homes for Sale
Expert local guidance backed by real-time market intelligence. Whether you’re buying your first home or selling a longtime residence in Palo Alto, data-driven decisions start here.
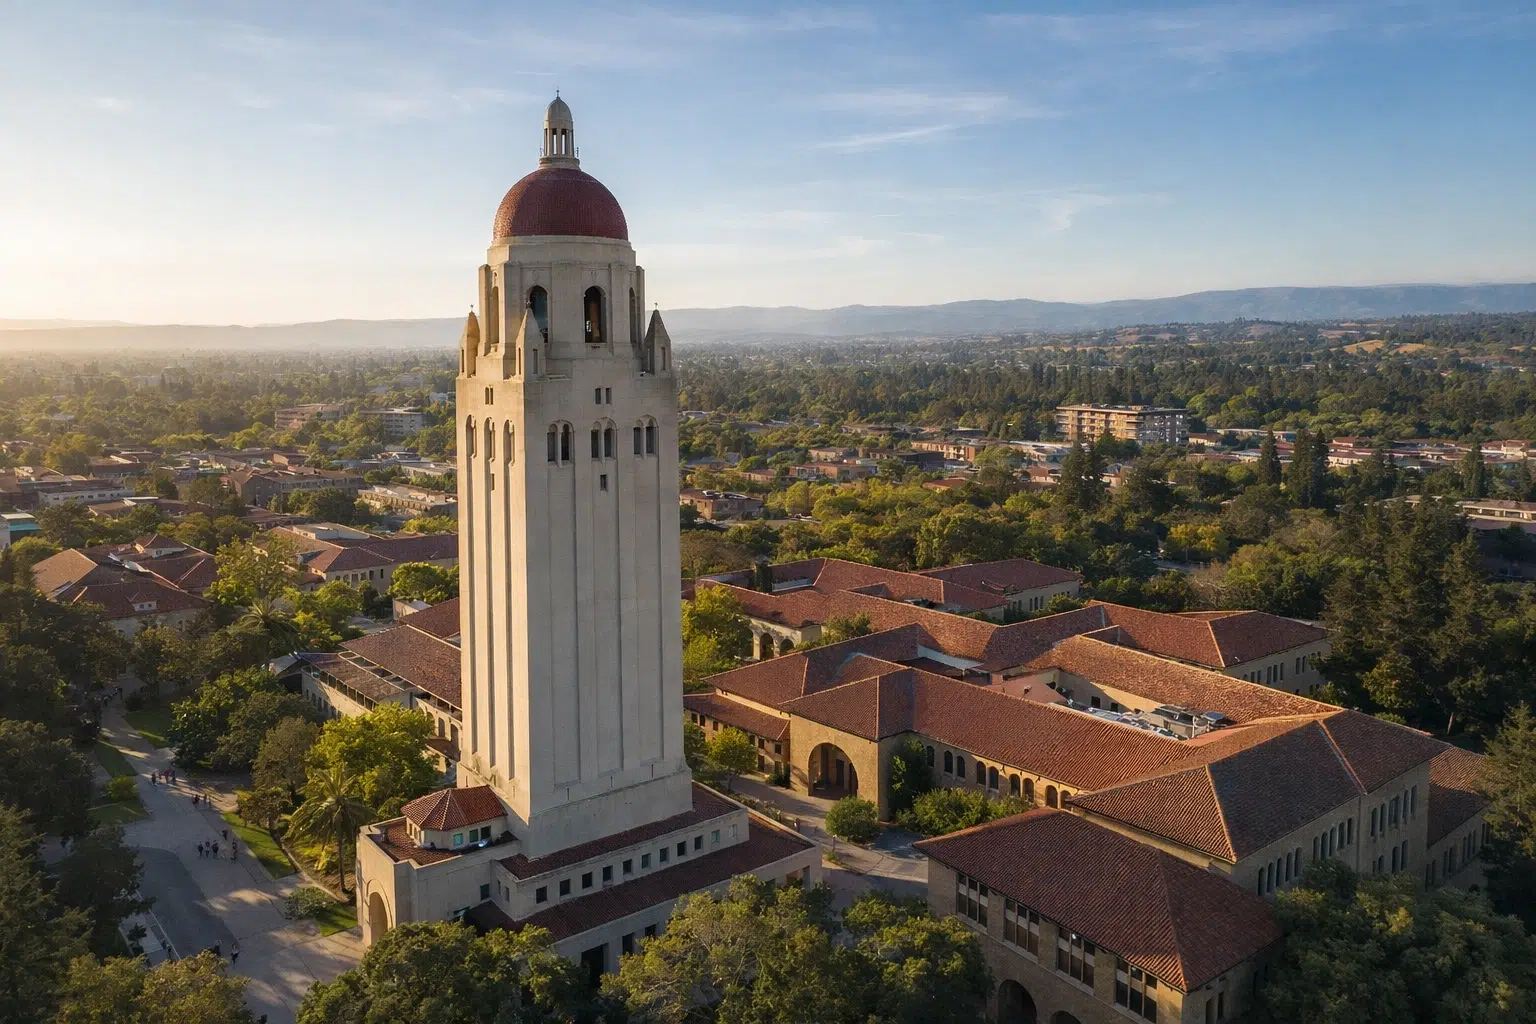

Welcome to Palo Alto
Incorporated 1894
Palo Alto, California
Palo Alto sits on the San Francisco Peninsula, spanning 25.8 square miles between the Santa Cruz Mountains to the west and San Francisco Bay to the east. The city shares borders with Mountain View to the south, Los Altos and Los Altos Hills to the southwest, and Menlo Park to the north. Incorporated in 1894, Palo Alto has evolved from a university town into one of Silicon Valley’s most established residential communities, home to 68,572 residents with a median household income of $203,000. The city’s geography creates distinct neighborhoods, from the flatter, tree-lined streets near downtown to hillside properties in the western foothills.
Commute access positions Palo Alto as a central hub for the peninsula’s technology corridor. Highway 101 and Interstate 280 provide direct routes throughout Silicon Valley, while Caltrain stations at University Avenue and California Avenue offer rail service to San Francisco and San Jose. The proximity to major employers—Stanford University borders the city, and Google, Facebook, and Apple campuses sit within a 10-mile radius—makes the location practical for tech professionals. University Avenue serves as the primary downtown retail district, running from the Caltrain station to the Stanford campus gates, with additional commercial activity along California Avenue and in the Stanford Shopping Center area.
The housing stock reflects Palo Alto’s development across more than a century, with neighborhoods featuring Craftsman bungalows, Eichler homes, Mediterranean-style estates, and contemporary builds. Older neighborhoods like Old Palo Alto, Professorville, and Crescent Park contain homes from the early 1900s through the 1940s, often on larger lots with mature landscaping. Mid-century neighborhoods such as Greenmeadow and Fairmeadow showcase post-war ranch homes and Eichlers. The Barron Park and Esther Clark Park areas offer more modest single-family homes, while hillside properties in the western sections command views and privacy. Current market data shows an average sale price of $4.16 million and homes spending an average of 22 days on market.
Why Buyers Choose Palo Alto
Buyers prioritize Palo Alto for its public school system, which consistently ranks among California’s highest-performing districts, and its established neighborhoods with walkable access to downtown amenities. The city’s location at the center of Silicon Valley’s employment base reduces commute times compared to communities farther north or south on the peninsula. Long-term residents appreciate the stable property values and limited new development, as the city’s constrained geography and restrictive zoning maintain housing scarcity. The combination of Stanford University’s cultural resources, extensive park systems including the Baylands Nature Preserve, and mature neighborhood character attracts families and professionals seeking a established community with urban conveniences and proximity to both bay and mountain recreation.
Palo Alto Real Estate: What the Data Says
Market Overview: Palo Alto’s Competitive Luxury Landscape
Palo Alto’s luxury real estate market remains intensely competitive despite recent cooling trends. With homes selling at an average of $3.57M and a remarkable sale-to-list ratio of 104.8%, properties are commanding prices above asking—a clear indicator of persistent buyer demand in this Silicon Valley hub. The average days on market sits at just 50 days, demonstrating that well-priced homes move quickly. However, the -10.6% year-over-year decline in prices signals a market recalibration from previous peaks, offering the first signs of moderation after years of aggressive appreciation. With inventory at 3.6 months—well below the 6-month threshold that defines a balanced market—Palo Alto remains firmly in seller-favorable territory, though the gap between list price ($3.47M) and sale price suggests strategic pricing remains essential.
For Buyers: What You Need to Know
Expect competition, but recognize you’re entering during a more favorable window than existed 12-18 months ago. The -10.6% year-over-year price decline represents a rare opportunity in a market that historically appreciates relentlessly, driven by Palo Alto’s top-tier schools, Stanford University proximity, and concentration of tech wealth. However, the 104.8% sale-to-list ratio means you cannot approach this market with a lowball mentality—homes are still selling above asking price. With only 3.6 months of inventory, you’re operating in a supply-constrained environment where desirable properties receive multiple offers. The 22-day average market time means you must be pre-approved, ready to move decisively, and prepared to compete. Consider offering terms beyond price—flexible closing dates, limited contingencies, or rent-back options—to strengthen your position in multiple-offer scenarios.
For Sellers: Maximizing Your Sale Price
You retain significant leverage, but the market demands precision in execution. The 104.8% sale-to-list ratio indicates that competitively priced homes are attracting bidding wars, but the gap between the average list price of $3.57M and sale price of $3.57M reveals that overpricing backfires. Strategic pricing slightly below market value can trigger competitive urgency, while listing too aggressively may result in extended days on market and eventual price reductions. The 22-day sales cycle suggests properly positioned properties sell quickly—if your home languishes beyond 50 days, it signals a pricing or presentation issue. With 3.6 months of inventory, scarcity works in your favor, but the -10.6% year-over-year trend indicates the window for peak pricing may be narrowing. Invest in professional staging, high-quality photography, and pre-listing inspections to minimize negotiation obstacles. In this market, the difference between a good sale and an exceptional one often comes down to presentation and the first two weeks of market exposure.
Balanced
Buyer’s Market
