
About the segment
About Single-Family Homes for Sale in Campbell, CA
Single-Family Homes for Sale in Campbell, CA are currently averaging $2,279,434 with an average of 22 days on market. There are 37 active listings. The average price per square foot is $1,294.
Campbell is part of the Silicon Valley / Central Coast market. Data from MLSListings Inc., refreshed every 15 minutes.
Current Single-Family Homes in Campbell
8 featured on this page · 37 active in this segment
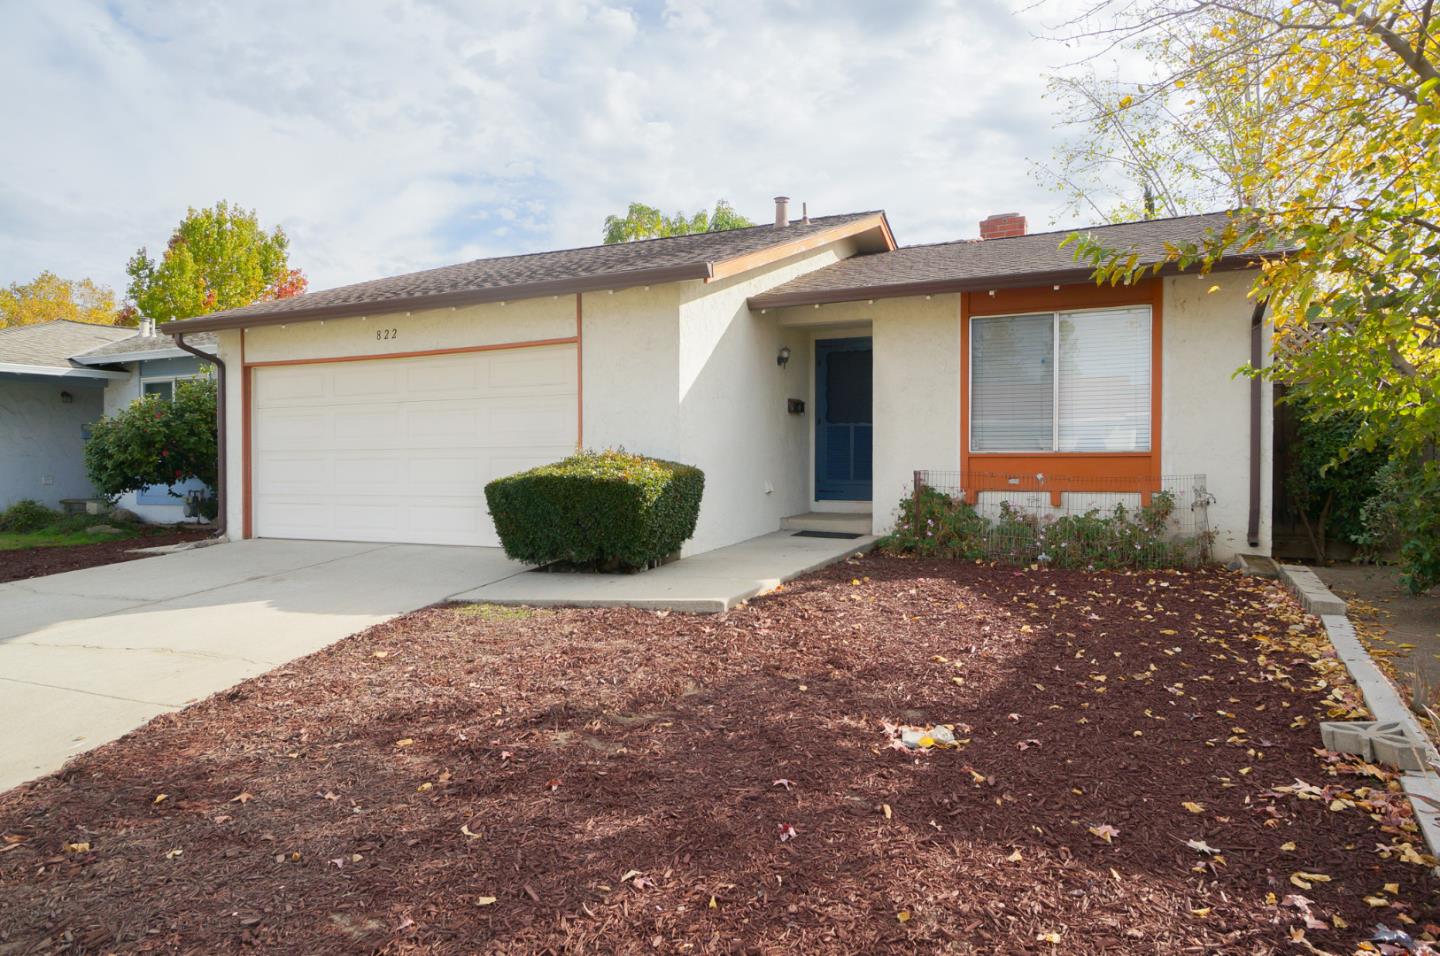
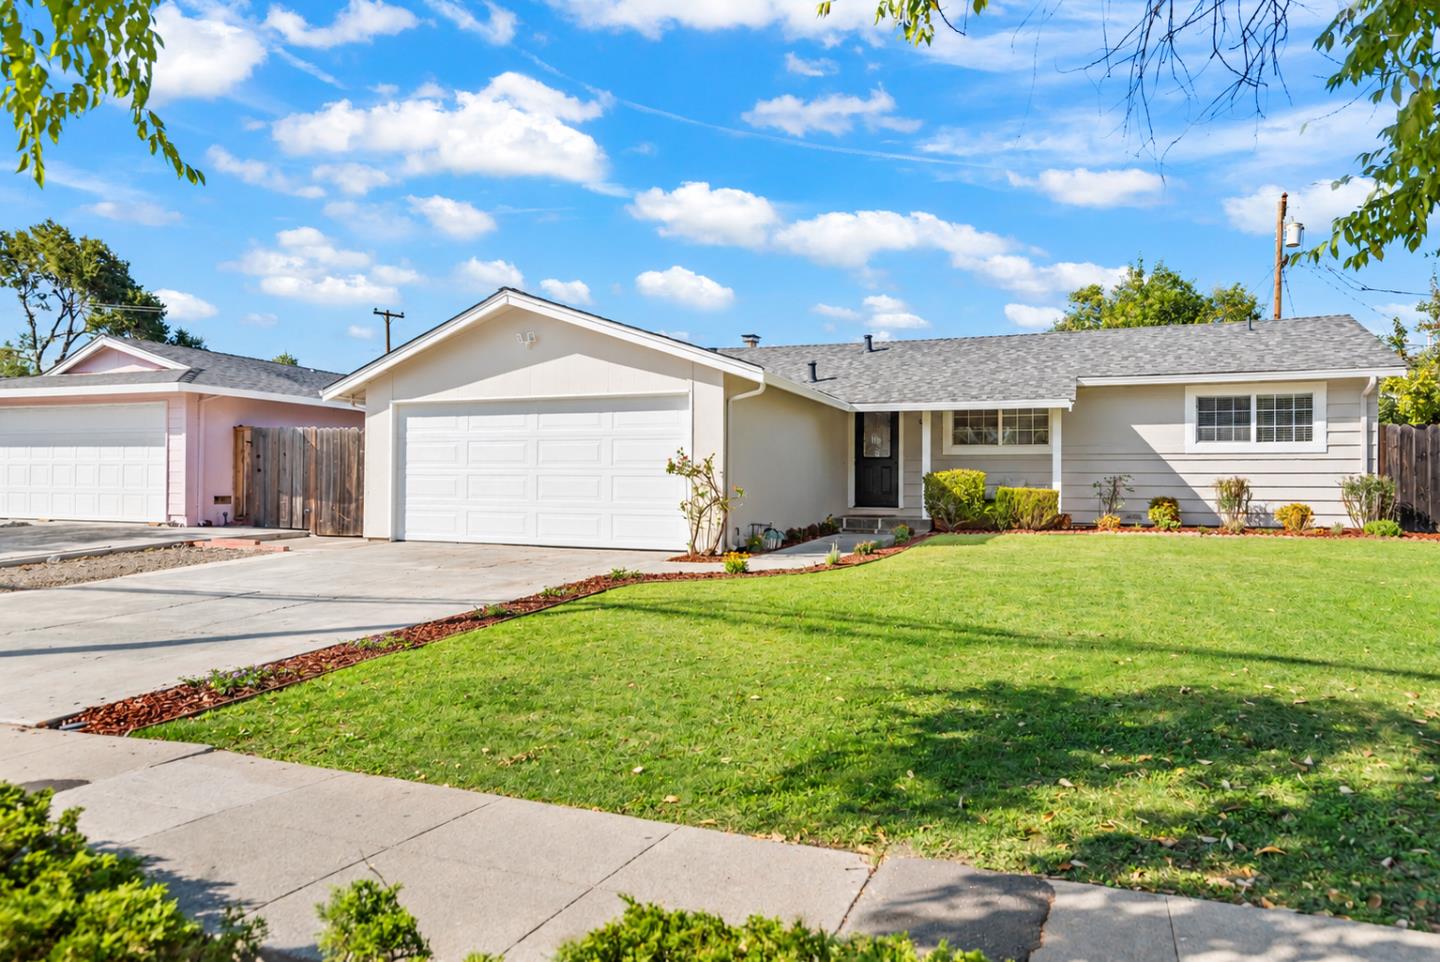
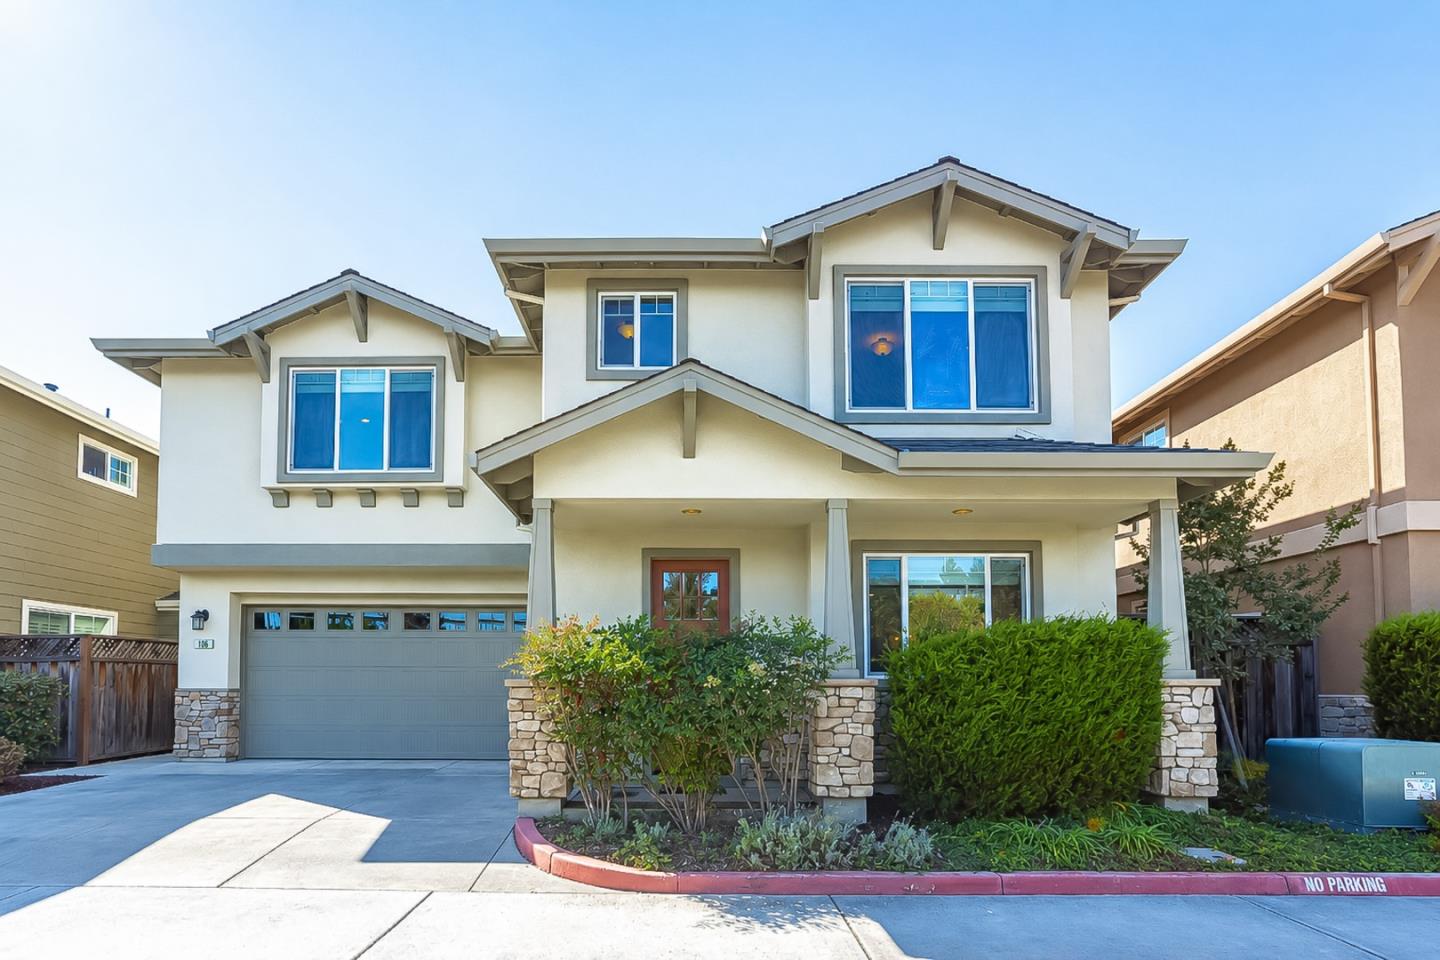
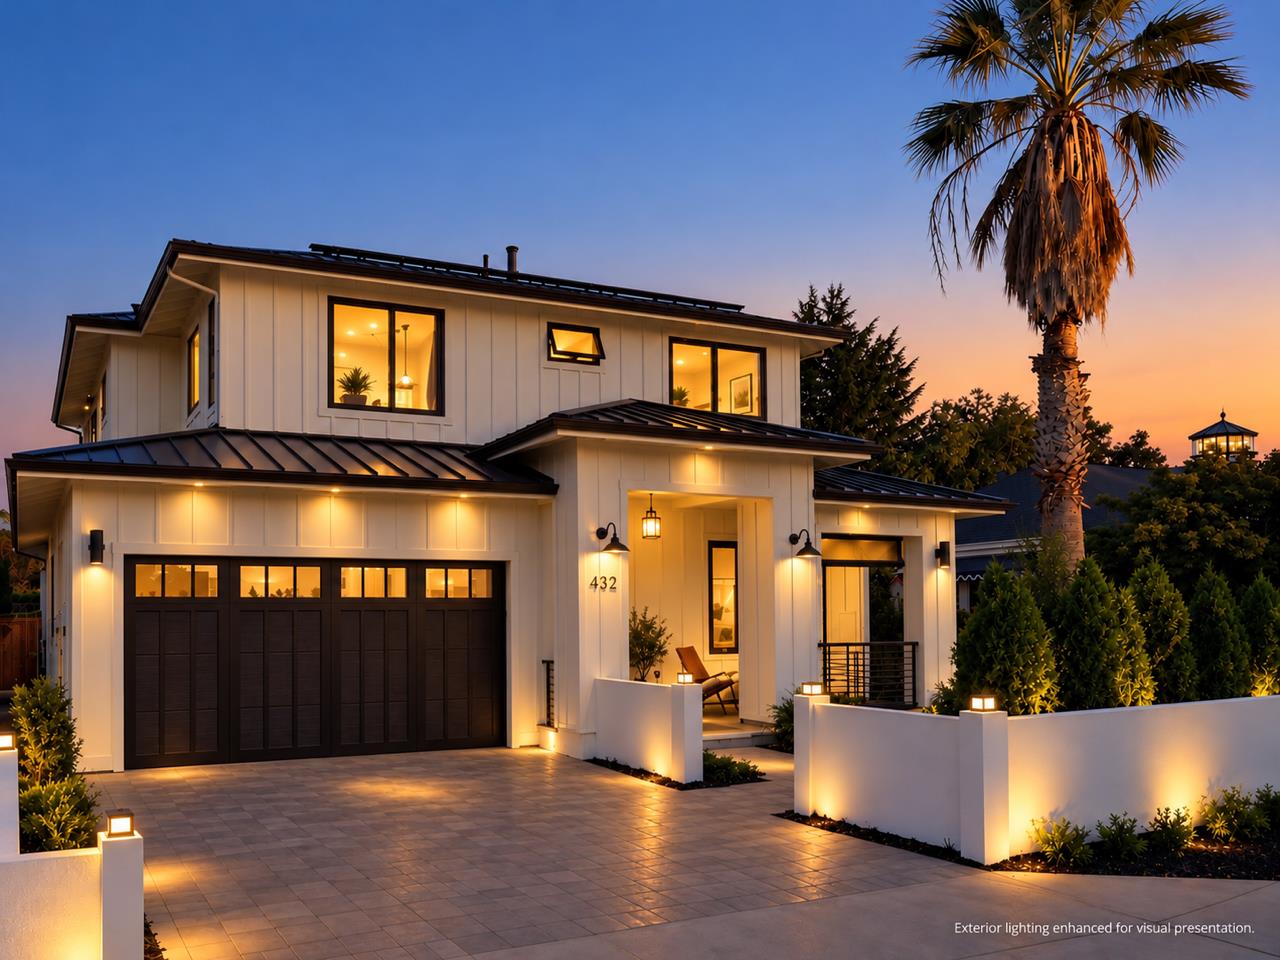
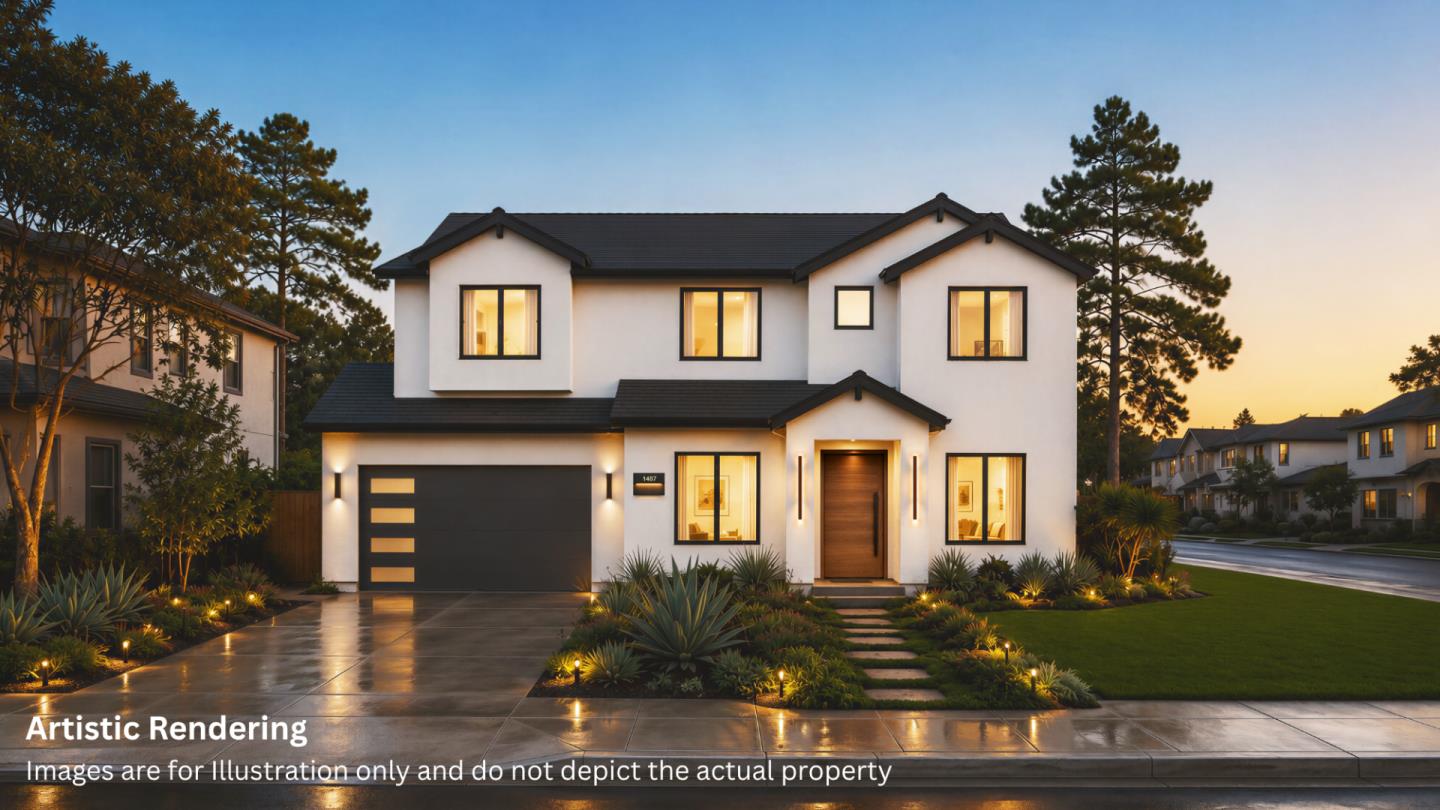
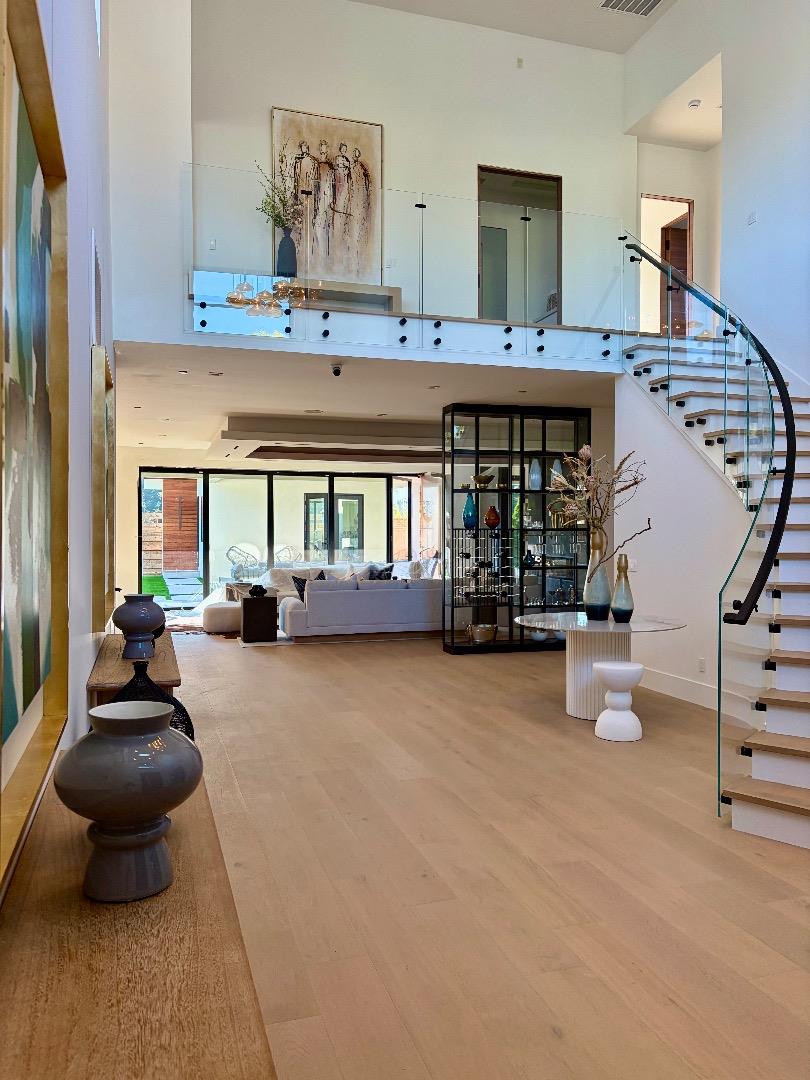
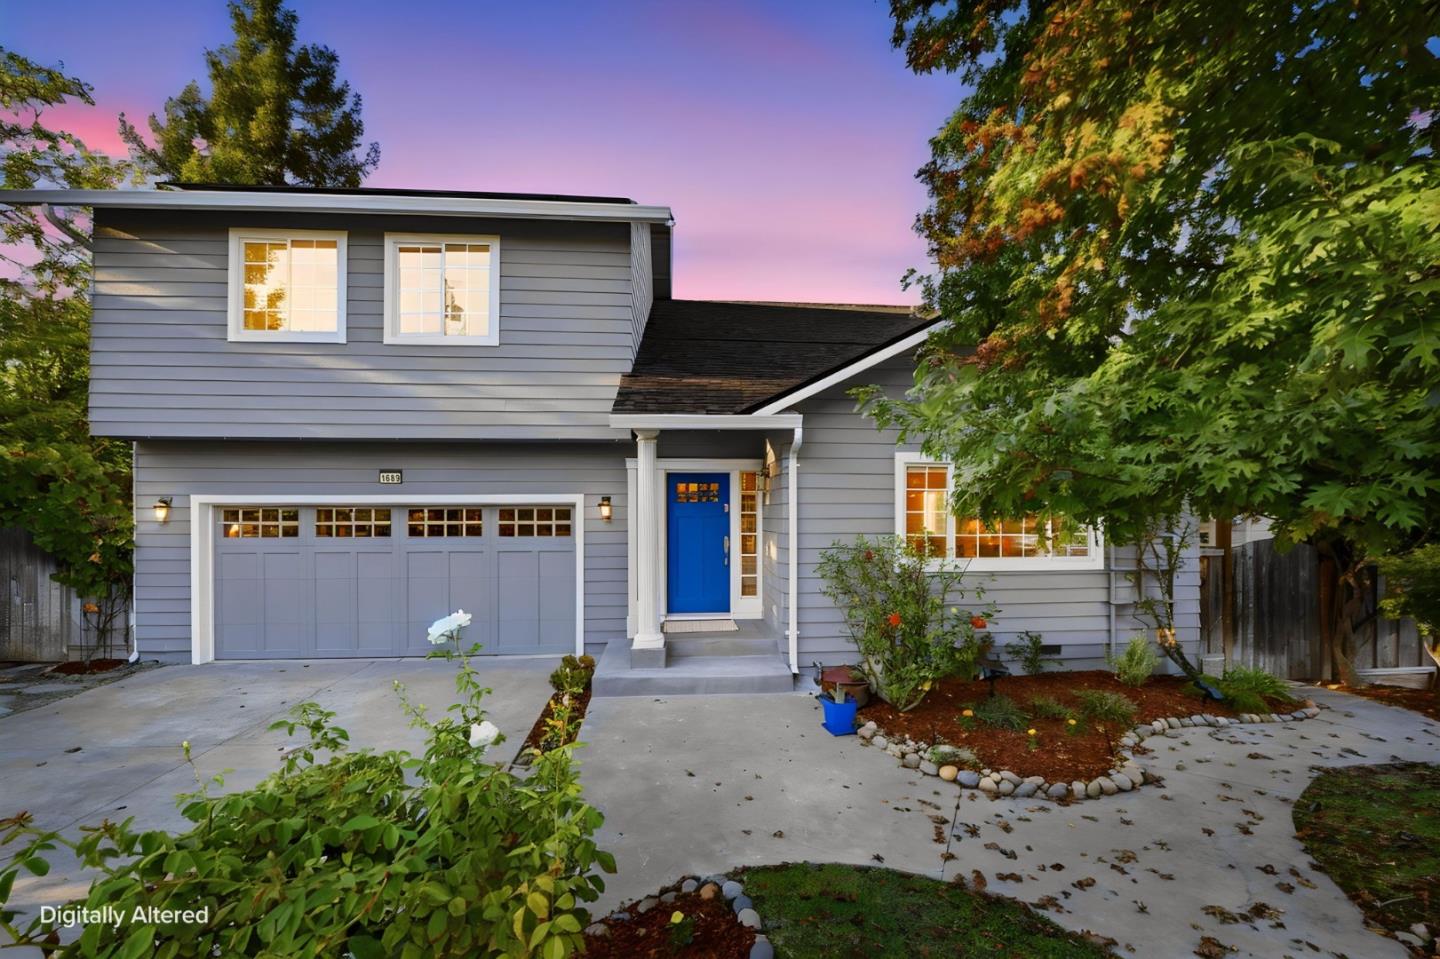
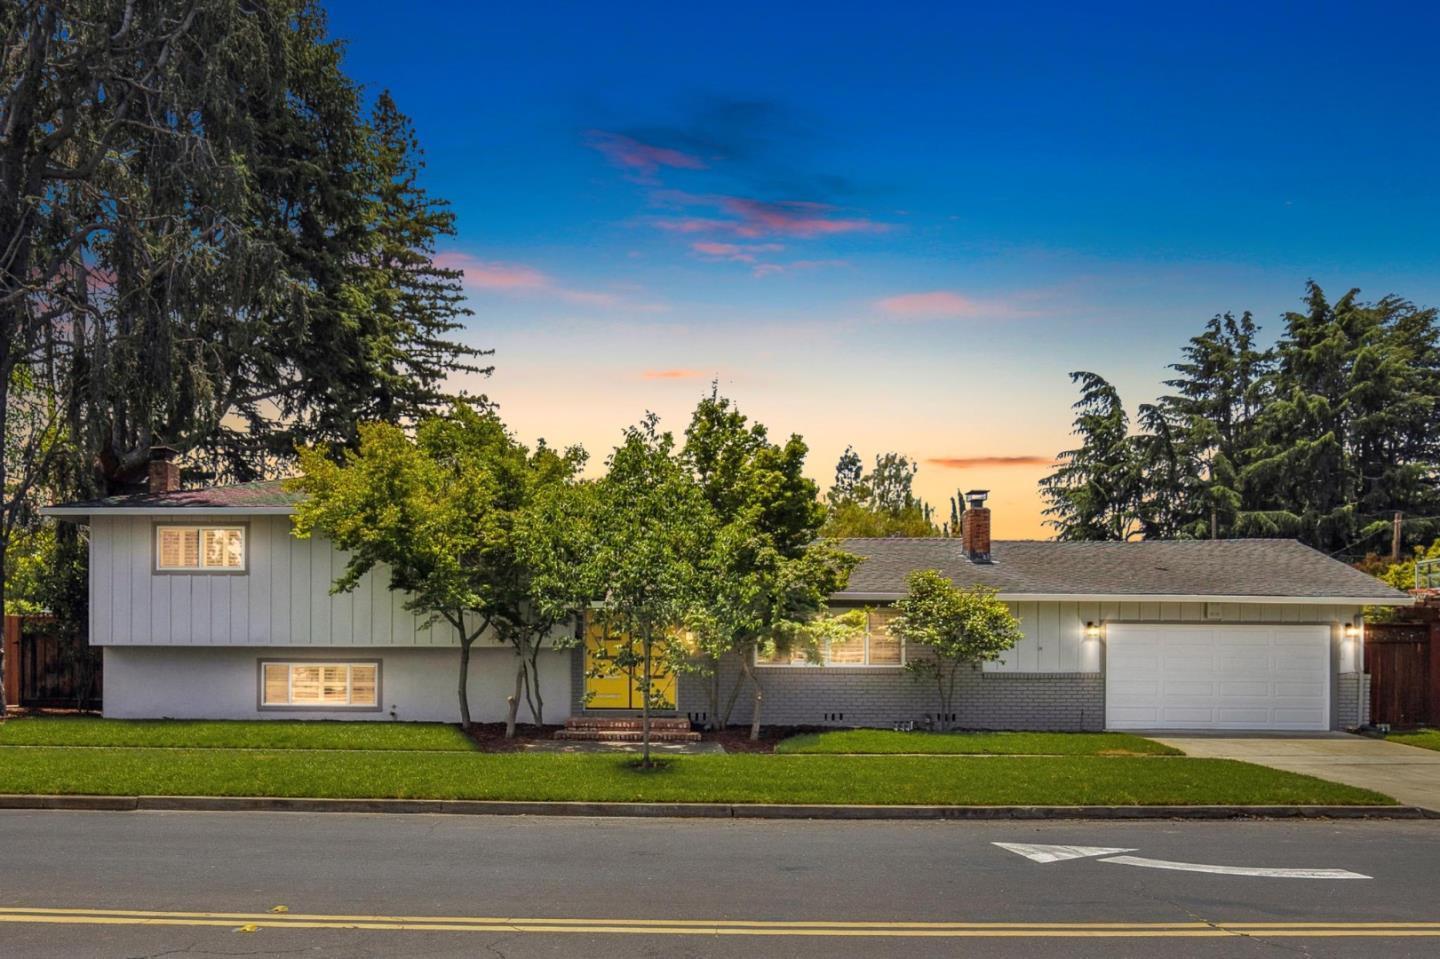
How much do single-family homes cost in Campbell? The current average price for single-family homes in Campbell, CA is $2,279,434, up 2.9% vs Last Year. This segment is averaging 22 days on market and selling at 103.6% of asking price.
There are currently 37 active single-family homes in Campbell. At the current absorption rate, this is approximately 2.5 months of inventory.
The average runs $1,294 per square foot, calculated from closed sales over the trailing twelve months.
With live MLS alerts: see it the moment it hits, with comps and context, and decide with data.
Segment scope. Every single-family figure on this page counts only Campbell listings that match the Single-Family segment. A Campbell listing outside that segment is not in these figures, and a home with a Campbell mailing address that the MLS classifies to another city is not either.
Figures labelled citywide cover all Campbell listings regardless of segment and are shown for comparison only. Where a label does not say citywide, the figure is the exact single-family segment. Every figure comes from the MLSListings Inc. compilation. Active counts are recalculated on a fifteen minute cycle. Closed-sale metrics are recalculated when the reporting period closes. Each has one definition and one label, used the same way everywhere on this page.
- Active Listings is a count of exact single-family Campbell listings in active or contingent status at the snapshot time. It includes active and contingent and excludes pending and sold.
- Avg Sale Price is the average closed price for the exact single-family segment.
- Avg Days on Market is the average number of days from list to contract for single-family segment homes that have closed. It excludes homes currently active.
- Price per Sq Ft is the average of closed price divided by finished square footage for the exact single-family segment.
- Sale to List is closed price divided by final list price for the single-family segment. Where a home was reduced before selling, the reduction is not counted against the ratio. A ratio calculated against original list price would be lower.
- Months of Supply is active segment listings divided by the average monthly closed count for the single-family segment.
- vs Last Year compares each closed-sale reporting period with the equivalent period one year earlier. Snapshot metrics, meaning Active Listings, compare with the corresponding prior-year snapshot rather than with a period.
Where a figure could not be verified against the compilation for the stated scope at render time, it renders as a dash. It is never estimated and never carried over from a prior refresh.
Open Houses This Weekend, Single-Family in Campbell
OPEN SAT, 1PM TO 4PM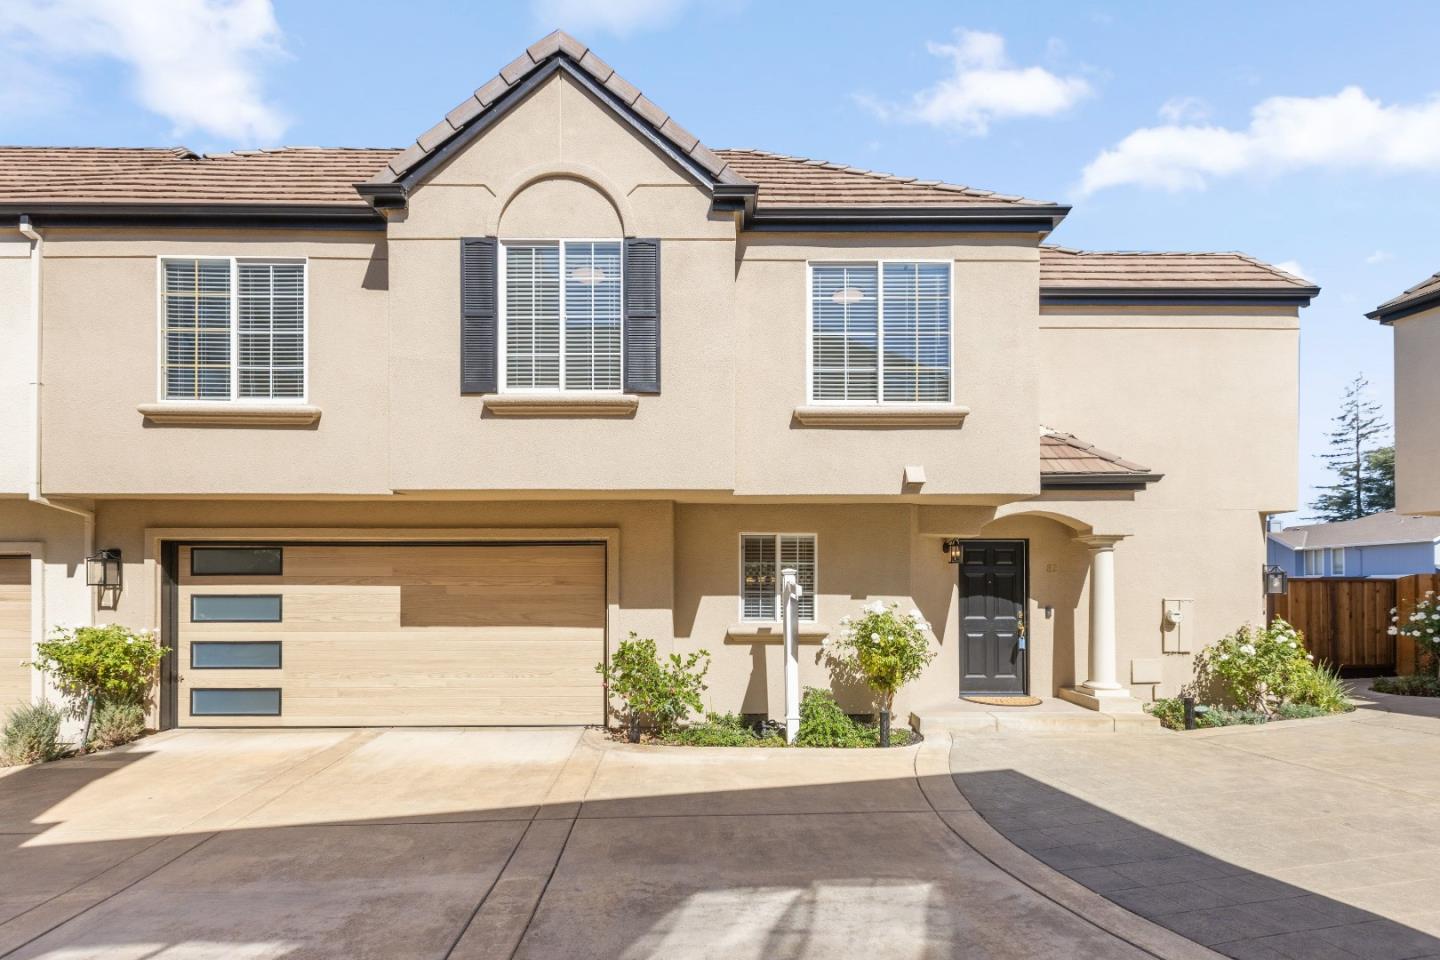 OPEN SAT, 1PM TO 4PM
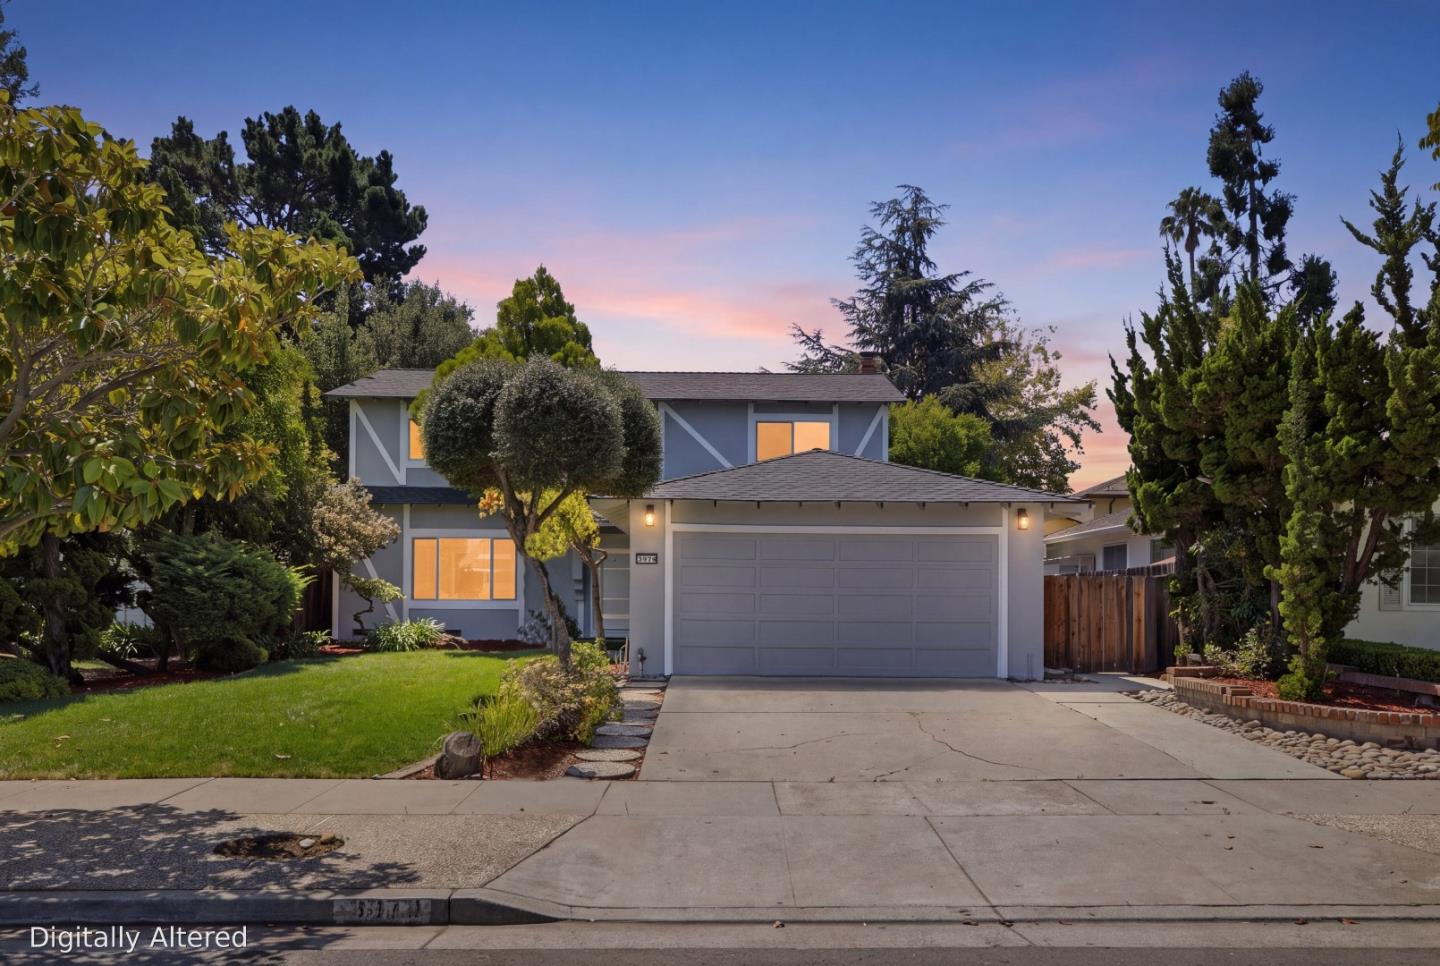 OPEN SAT, 1PM TO 4PM
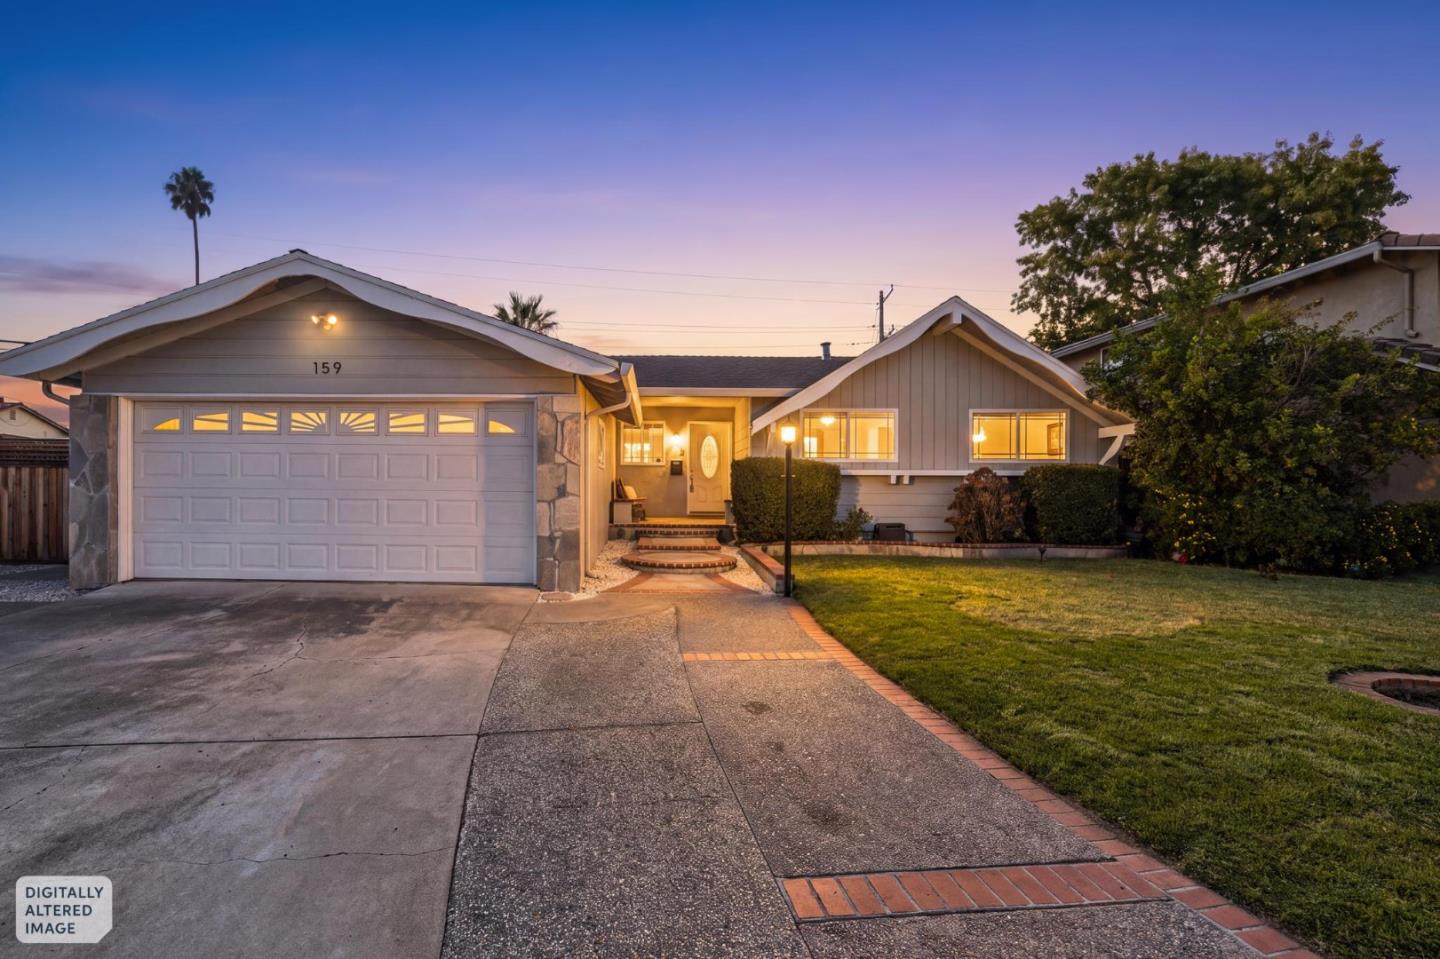 OPEN SAT, 2PM TO 4PMOPEN SAT, 3:30PM TO 5:30PM
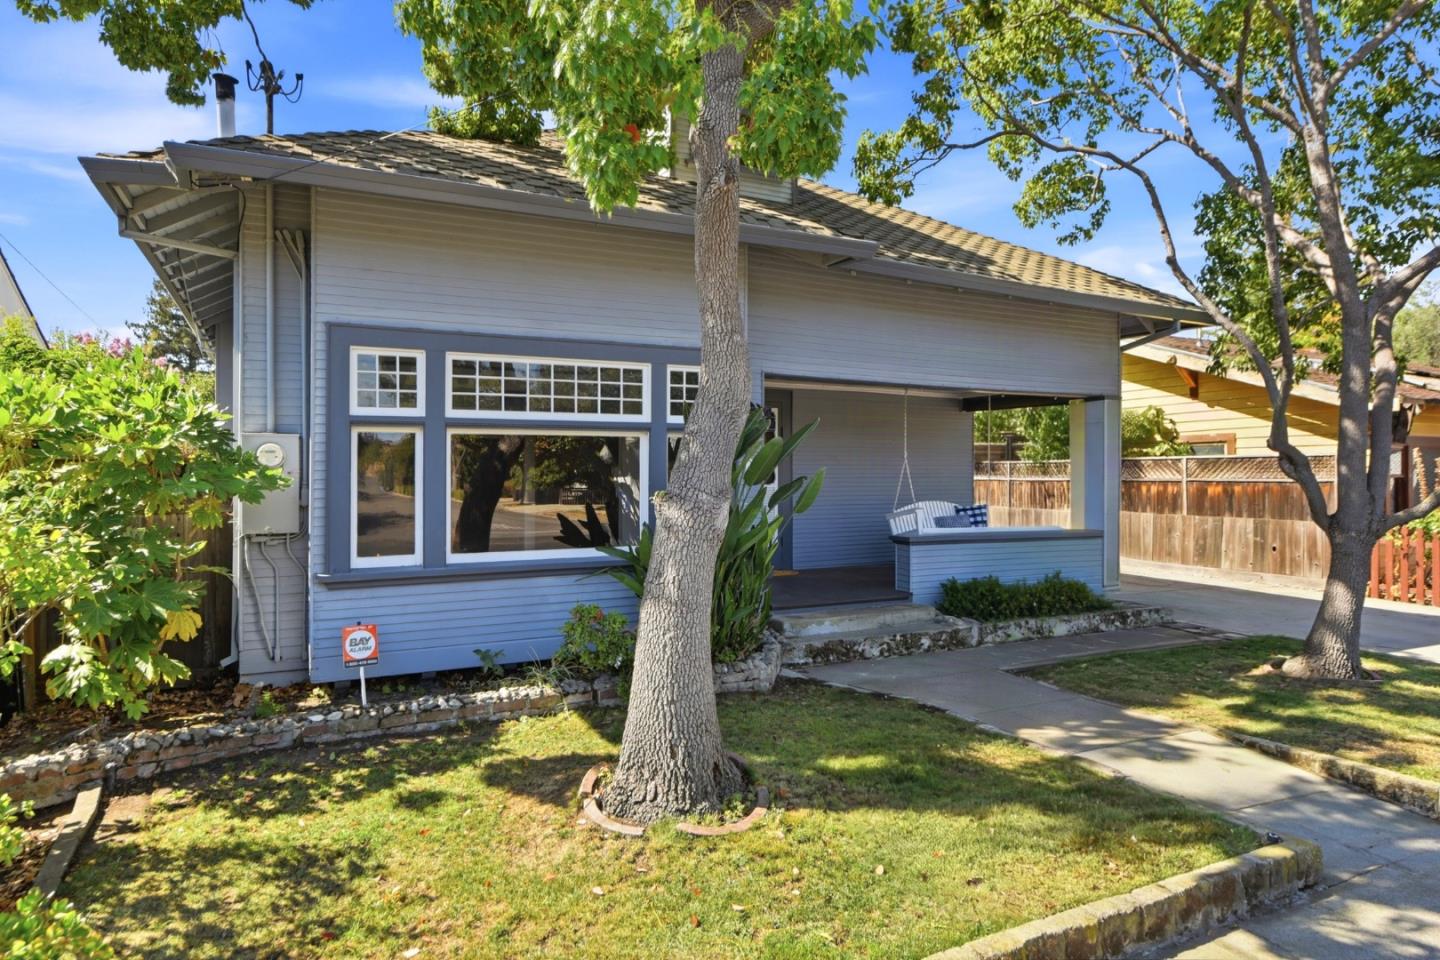 OPEN SUN, 1PM TO 4PM
Hot This Week in Campbell
Single-Family Homes for Sale in Campbell: What You Need to Know
Campbell offers strong, sustained housing demand. The single-family homes scope is one of the most actively searched in this market. With 37 active listings and approximately 2.5 months of supply, finding the right home here rewards strategy, speed, and accurate data.
For Buyers
At 22 days average on market, well-priced single-family homes can attract strong interest quickly. The average price of $2,279,434 reflects real buyer demand. The most successful buyers see listings early, arrive pre-approved with an offer strategy, and understand comparable sales so they can bid with data.
For Sellers
Homes here are selling at 103.6% of asking price, and well-positioned listings generate competitive interest. Pricing in line with recent comparable sales to create competitive tension has consistently outperformed the list-high approach.

"The difference between getting the home and losing it often comes down to a few hours. My clients see listings the moment they hit the MLS, with comp data and an offer range already attached."Timothy Alston, Broker, Aegis Luxury Real Estate
Why Single-Family Homes for Sale in Campbell Stand Out
Recently Sold in Campbell
Closed within 12 months · Campbell
$1,171/sqft · +4.5% above list
 BQ Realty
$974/sqft · +6.0% above list
Michelle Tancredi, Broker$1,264/sqft · +14.0% above list
Intero Real Estate Services$1,473/sqft · +15.4% above list
Intero Real Estate Services$907/sqft · +5.0% above list
Michelle Tancredi, Broker$1,523/sqft · +8.0% above list
DPL Real EstateRates vs. prices: Monitoring the scope as listings hit lets you act on data, not headlines.
You don't have to bid blind: Our alerts include real comparable sales so you know what similar homes actually sold for.
The data-backed move: With about 2.5 months of supply, watching new listings as they hit is a structural advantage.