United States Homeowners vs Renters Statistics
87.0 million U.S. households own their home and 46.8 million rent, a split of 65.0% to 35.0% and 1.86 owner households for every renter household in the second quarter of 2026. Owners are the majority in every region, from 60.5% in the West to 69.0% in the Midwest, and in every age group except householders under 35, where renters are 64.8%. The rental vacancy rate is 7.3% against a homeowner vacancy rate of 1.2%, and the median asking rent for a vacant unit is $1,531 a month.
Key United States Homeowners vs Renters Statistics
U.S. Census Bureau CPS/HVS and NAR data- Owner households: 87.0 million (65.0%); renter households: 46.8 million (35.0%). (Census Bureau, CPS/HVS Q2 2026)
- That is 1.86 owner households for every renter household. (Aegis calculation from Census Bureau)
- Owner-occupied units are 58.2% of all housing units and renter-occupied 31.3%; the remaining 10.5% are vacant. (Census Bureau)
- Renters are the majority only among householders under 35, at 64.8%; owners are 78.6% of householders 65 and over. (Census Bureau)
- Below median family income, 47.9% of households rent; at or above the median, 22.1% rent. (Census Bureau)
- The rental vacancy rate is 7.3%, on a rising trend since 2023; the homeowner vacancy rate is 1.2%. (Census Bureau)
- Rental vacancy is highest in the South at 9.5% and lowest in the West at 5.3%. (Census Bureau)
- Median asking rent for a vacant unit: $1,531 a month; median asking price for a vacant for-sale unit: $343,800. (Census Bureau)
- Owner households grew by 780,000 and renter households by 450,000 over the year to Q2 2026. (Census Bureau)
- The median existing-home sale price was $434,100 in July 2026, up 2.0% year over year. (NAR)
How Many U.S. Households Own vs Rent?
87.0 million households own and 46.8 million rent, out of 133.8 million occupied households in the second quarter of 2026. That is 65.0% owners, 35.0% renters, and 1.86 owner households for every renter household.
| Tenure | Q2 2026 households | Share of occupied | Share of all units | Q2 2025 (revised) | Change |
|---|---|---|---|---|---|
| Owner-occupied | 86,985,000 | 65.0% | 58.2% | 86,205,000 | +780,000 |
| Renter-occupied | 46,827,000 | 35.0% | 31.3% | 46,377,000 | +450,000 |
| All occupied | 133,811,000 | 100.0% | 89.5% | 132,582,000 | +1,229,000 |
Source: U.S. Census Bureau, Housing Vacancies and Homeownership, Q2 2026, Table 3, vintage 2025 housing unit controls. Shares and ratio calculated by Aegis Luxury Real Estate.
Where Are Renters Concentrated?
In the West and Northeast. Renters are 39.5% of households in the West and 38.4% in the Northeast, against 33.1% in the South and 31.0% in the Midwest.
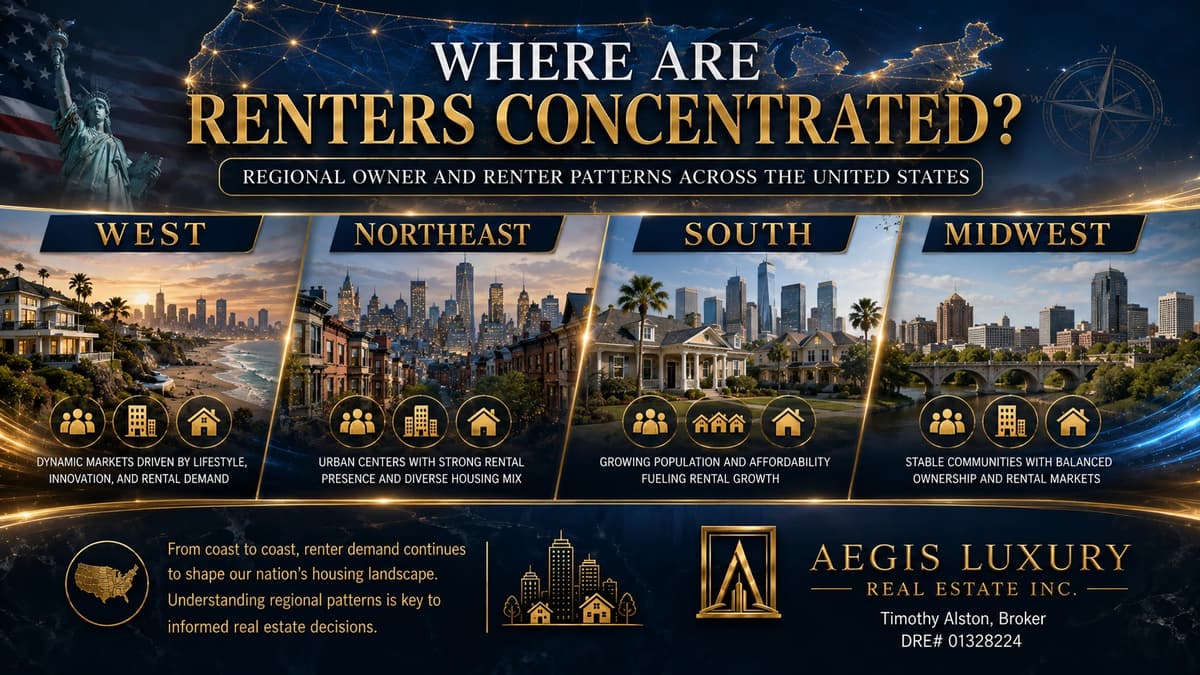
| Region | Owner share | Renter share | Rental vacancy rate | Median home price, July 2026 |
|---|---|---|---|---|
| West | 60.5% | 39.5% | 5.3% | $622,200 |
| Northeast | 61.6% | 38.4% | 5.9% | $563,800 |
| South | 66.9% | 33.1% | 9.5% | $371,700 |
| Midwest | 69.0% | 31.0% | 6.9% | $342,900 |
| United States | 65.0% | 35.0% | 7.3% | $434,100 |
Sources: U.S. Census Bureau, CPS/HVS Q2 2026, Tables 2 and 5. Renter share is 100 minus the homeownership rate. Median price from NAR Existing-Home Sales, July 2026, for context.
How Does the Owner-Renter Split Change With Age and Income?
It reverses. Among householders under 35, 64.8% rent. Among householders 65 and over, 21.4% rent. Below median family income, 47.9% rent; at or above the median, 22.1% rent.
| Group | Owner share | Renter share | Change in owner share vs Q2 2025 |
|---|---|---|---|
| Under 35 | 35.2% | 64.8% | -1.2 pts |
| 35 to 44 | 60.9% | 39.1% | -0.1 pts |
| 45 to 54 | 69.7% | 30.3% | +0.5 pts |
| 55 to 64 | 75.1% | 24.9% | -0.7 pts |
| 65 and over | 78.6% | 21.4% | 0.0 pts |
| Family income at or above median | 77.9% | 22.1% | -0.8 pts |
| Family income below median | 52.1% | 47.9% | +0.7 pts |
| All households | 65.0% | 35.0% | 0.0 pts |
Source: U.S. Census Bureau, CPS/HVS Q2 2026, Tables 6 and 8. Renter share is 100 minus the published homeownership rate for each group.
The under-35 owner share fell 1.2 points over the year, the only statistically significant age-group change. Every other cohort is within a point of a year ago.
Which Side of the Market Is Tighter?
The owner side, by a wide margin. The homeowner vacancy rate is 1.2% and the rental vacancy rate 7.3%. Rental vacancy has been rising steadily since 2023; homeowner vacancy has edged up from 0.8% to 1.2% over the same period.
| Year (Q2) | Rental vacancy rate | Homeowner vacancy rate |
|---|---|---|
| 2020 | 5.7% | 0.9% |
| 2021 | 6.2% | 0.9% |
| 2022 | 5.6% | 0.8% |
| 2023 | 6.3% | 0.7% |
| 2024 | 6.6% | 0.9% |
| 2025 | 7.0% | 1.1% |
| 2026 | 7.3% | 1.2% |
Source: U.S. Census Bureau, CPS/HVS, Table 1. Rental vacancy is vacant year-round units for rent as a share of the rental inventory; homeowner vacancy is vacant units for sale only as a share of the owner inventory. Definitions in the release's explanatory notes.
What Do Renters and Buyers Face in Asking Prices?
The median asking rent for a vacant rental unit was $1,531 a month in the second quarter of 2026. The median asking sales price for a vacant for-sale unit was $343,800. The median price of an existing home actually sold in July 2026 was $434,100.
| Measure | Value | Period | Universe | Source |
|---|---|---|---|---|
| Median asking rent, vacant units | $1,531 / month | Q2 2026 | Vacant for-rent units | Census Bureau CPS/HVS |
| Median asking sales price, vacant units | $343,800 | Q2 2026 | Vacant for-sale-only units | Census Bureau CPS/HVS |
| Median existing-home sale price | $434,100 | July 2026 | All closed existing-home sales | NAR |
| Median household income | $83,730 | 2024 | All households | Census Bureau CPS ASEC |
Sources: U.S. Census Bureau, CPS/HVS Q2 2026 (asking rent and asking price, Historical Table 11); NAR Existing-Home Sales, July 2026; Census Bureau P60-286. Asking figures are not adjusted for unit size, quality or location and are not comparable to sold medians.
Aegis Analysis: Derived Statistics
The figures below are calculated by Aegis Luxury Real Estate from the published Census Bureau tables. Each shows its formula so it can be reproduced.
| Statistic | Formula | Result |
|---|---|---|
| Owner to renter ratio | 86,985,000 owner households / 46,827,000 renter households | 1.86 |
| Regional renter-share spread | 39.5% West renter share minus 31.0% Midwest renter share | 8.5 points |
| Vacancy-rate multiple | 7.3% rental vacancy / 1.2% homeowner vacancy | 6.08x |
| Owner share of occupied-household growth | 780,000 owner increase / 1,229,000 total increase, Q2 2025 to Q2 2026 | 63.5% |
| Renter share of occupied-household growth | 450,000 renter increase / 1,229,000 total increase | 36.6% |
| Owner-occupied share of all housing units | 86,985,000 / 149,454,000 total units | 58.2% |
Inputs: U.S. Census Bureau, CPS/HVS Q2 2026, Tables 1, 3 and 5. Rounding: results are shown to the precision the inputs support. Owner and renter growth shares sum to 100.1% because the published component changes are independently rounded. The Census inputs and Aegis outputs are available as; NAR figures are referenced by URL in the file, not reproduced.
How These United States Figures Are Calculated
Owner and renter household counts, tenure shares by region, age and income, and vacancy rates come from the U.S. Census Bureau's Current Population Survey/Housing Vacancy Survey, second quarter 2026. Renter share is one hundred minus the published homeownership rate for each group. The median sold price is from NAR. The owner to renter ratio and shares of total units are calculated by Aegis Luxury Real Estate.
| Element | Definition |
|---|---|
| Source | U.S. Census Bureau, Housing Vacancies and Homeownership (CPS/HVS), Q2 2026, release CB26-116 |
| Tenure | Owner-occupied and renter-occupied households; universe is occupied housing units |
| Renter share | 100 minus the published homeownership rate for the group |
| Vacancy rates | Rental: vacant year-round units for rent over rental inventory. Homeowner: vacant units for sale only over owner inventory. Formulas in the release explanatory notes |
| Asking rent and price | Medians for vacant units only, Historical Table 11A/B; not comparable to sold medians |
| Context price | NAR Existing-Home Sales, July 2026, median of closed sales |
| Margins of error | National rates ±0.5 points; regional rental vacancy ±0.4 to 0.7; at 90% confidence |
| Release identifiers | Census CB26-116 (July 28, 2026), press PDF at census.gov/housing/hvs/files/currenthvspress.pdf; NAR Existing-Home Sales July 2026 (August 11, 2026); Census P60-286 (September 9, 2025) |
| Refresh | Quarterly. Next release October 28, 2026 |
Every figure on this page resolves to a token in the Aegis Stats Engine with a recorded source, vintage and verification date. No figure originates from a consumer portal, a commercial aggregator, or an automated valuation model.
Official Sources for United States Owner and Renter Data
Every figure on this page can be checked at its origin. These are the primary records, not summaries of them.
Using these figures
Journalists, researchers, students, and other sites are welcome to cite this page and link to the permanent URL so readers can check each figure against its source and see the current version. Aegis-original calculations, the compilation structure and the statistical graphics on this page may be reused with attribution to Aegis Luxury Real Estate and a link to this URL. U.S. Census Bureau figures are public domain. National Association of REALTORS figures are reproduced here for reference, are not relicensed by Aegis; obtain them from NAR under NAR's terms.
Timothy Alston. "United States Homeowners vs Renters Statistics." Aegis Luxury Real Estate, DRE# 01328224, updated August 18, 2026. https://aegishomesre.com/homeowners-vs-renters-statistics/
https://aegishomesre.com/homeowners-vs-renters-statistics/
This URL does not change. The page is updated in place rather than republished, so a link placed today continues to resolve to the current figures. For data questions, contact Timothy Alston at aegishomesre.com/contact.
Frequently Asked Questions
How many households rent in the United States?
46.8 million in the second quarter of 2026, or 35.0% of the 133.8 million occupied households. 87.0 million households own, giving 1.86 owner households for every renter household.
Which region has the most renters?
The West, where 39.5% of households rent, followed by the Northeast at 38.4%. The Midwest has the fewest at 31.0%. The West and Northeast have the two highest renter shares and the two highest regional median existing-home prices.
At what age do renters become the minority?
Renters are already the minority in the 35 to 44 age group. They are 64.8% of householders under 35 and 39.1% of those 35 to 44. By 45 to 54 renters are 30.3%, and by 65 and over 21.4%.
Is it easier to find a rental or a home to buy?
On vacancy-rate availability alone, the rental inventory is looser. The rental vacancy rate is 7.3% and has been rising since 2023; the homeowner vacancy rate is 1.2%. Vacancy rates describe available units, not how hard any individual search will be.
What is the median rent in the United States?
The Census Bureau's median asking rent for vacant rental units was $1,531 a month in Q2 2026. That is an asking figure for units currently vacant, not the median rent paid by all renters, which the American Community Survey reports separately and lower.
How does Santa Clara County compare?
The Santa Clara County page reports owner and renter shares by city from the American Community Survey. The county renter share sits above the national 35.0%, and the county median closed sale price of $1,648,944 (MLSListings, trailing twelve months) is roughly 3.8 times the national $434,100; see that page for the fifteen city breakdown.

Timothy Alston
Timothy Alston is a licensed California real estate Broker serving 53 communities across Santa Clara, San Mateo, Santa Cruz and Monterey Counties. This reference page is maintained as part of an ongoing statistical series and is updated in place when its source data or methodology materially changes.