Santa Clara County Home Price Statistics by City

Median home prices in Santa Clara County range from $1,100,000 in Gilroy to $5,475,000 in Los Altos Hills, a spread of 5.0x across fifteen cities. The county median is $1,648,944 across 10,536 closed sales in the trailing twelve months. Price per square foot runs from $524 in Gilroy to $1,937 in Palo Alto.
Key Santa Clara County Home Price Statistics
MLSListings Inc. closed data- The median closed sale price in Santa Clara County is $1,648,944. (MLSListings Inc.)
- Los Altos Hills is the most expensive city in Santa Clara County at a median of $5,475,000. (MLSListings Inc.)
- Gilroy is the least expensive at $1,100,000, one fifth of Los Altos Hills. (MLSListings Inc.)
- Palo Alto carries the highest price per square foot at $1,937, not Los Altos Hills. (MLSListings Inc.)
- Price per square foot in Santa Clara County spans 3.7x, from $524 in Gilroy to $1,937 in Palo Alto. (MLSListings Inc.)
- Eleven of the fifteen Santa Clara County cities sit above the county median price, and only four sit below it. (MLSListings Inc.)
- Four Santa Clara County cities carry a median above $4,000,000, and eight sit below $2,000,000. Almost nothing sits between. (MLSListings Inc.)
- San Jose accounts for 49.1% of all Santa Clara County closed sales, so the county median tracks San Jose closely. (MLSListings Inc.)
- The Los Altos Hills implied size benchmark is roughly 3,465 square feet, against 1,597 in San Jose. (Aegis calculation from MLSListings Inc. data)
- Median price per square foot across Santa Clara County is $969. (MLSListings Inc.)
What Is the Median Home Price in Santa Clara County?
The median closed sale price in Santa Clara County is $1,648,944, calculated across 10,536 closed residential transactions in the trailing twelve months. Median price per square foot is $969.
That single number describes no actual city in Santa Clara County. It sits above San Jose, below Santa Clara, and nowhere near either end of the range. A county median is useful for comparing Santa Clara County against other counties. It is the wrong figure for pricing a home, and this page exists to replace it with the fifteen numbers that matter.
Every price figure on this page is a median. Santa Clara County contains both Gilroy and Los Altos Hills, so a handful of very large sales pull an average far above what a typical buyer encounters. The Aegis live market stats dashboard reports averages on a fifteen minute refresh, which is the right measure for watching a market move. This page reports medians across a fixed twelve month window, which is the right measure for a citable reference figure. The two will not match, and both are correct.
Which Santa Clara County City Is Most Expensive?
Los Altos Hills, at a median sale price of $5,475,000. Monte Sereno follows at $4,668,000 and Los Altos at $4,515,000. Gilroy is least expensive at $1,100,000. Los Altos Hills carries a median 4.98 times Gilroy, a spread of $4,375,000 inside one county.
| Rank | City | Median sale price | Vs county median | Median price per sq ft | Closed sales |
|---|---|---|---|---|---|
| 1 | Los Altos Hills | $5,475,000 | 3.32x | $1,580 | 109 |
| 2 | Monte Sereno | $4,668,000 | 2.83x | $1,471 | 41 |
| 3 | Los Altos | $4,515,000 | 2.74x | $1,876 | 338 |
| 4 | Saratoga | $4,100,000 | 2.49x | $1,494 | 278 |
| 5 | Palo Alto | $3,510,000 | 2.13x | $1,937 | 530 |
| 6 | Cupertino | $3,055,000 | 1.85x | $1,504 | 257 |
| 7 | Los Gatos | $2,577,500 | 1.56x | $1,207 | 412 |
| 8 | Campbell | $1,920,000 | 1.16x | $1,078 | 281 |
| 9 | Sunnyvale | $1,865,000 | 1.13x | $1,263 | 794 |
| 10 | Mountain View | $1,852,500 | 1.12x | $1,112 | 498 |
| 11 | Santa Clara | $1,690,000 | 1.02x | $1,092 | 651 |
| 12 | San Jose | $1,402,000 | 0.85x | $878 | 5,175 |
| 13 | Morgan Hill | $1,350,000 | 0.82x | $632 | 443 |
| 14 | Milpitas | $1,315,000 | 0.80x | $800 | 299 |
| 15 | Gilroy | $1,100,000 | 0.67x | $524 | 387 |
| Santa Clara County | $1,648,944 | 1.00x | $969 | 10,536 |
Source: MLSListings Inc. closed residential transactions, trailing twelve months to August 11, 2026. Single family, condominium and townhome only.
Eight cities carry a median below $2,000,000 and four carry a median above $4,000,000. Only three fall between the two: Los Gatos at $2,577,500, Cupertino at $3,055,000 and Palo Alto at $3,510,000. Santa Clara County does have a middle, but it is thin, and a buyer moving from the lower cluster to the upper one crosses it in three steps rather than climbing a gradient.
Which City Has the Highest Price Per Square Foot?
Palo Alto, at $1,937 per square foot, not Los Altos Hills. Los Altos follows at $1,876. Gilroy is lowest at $524.
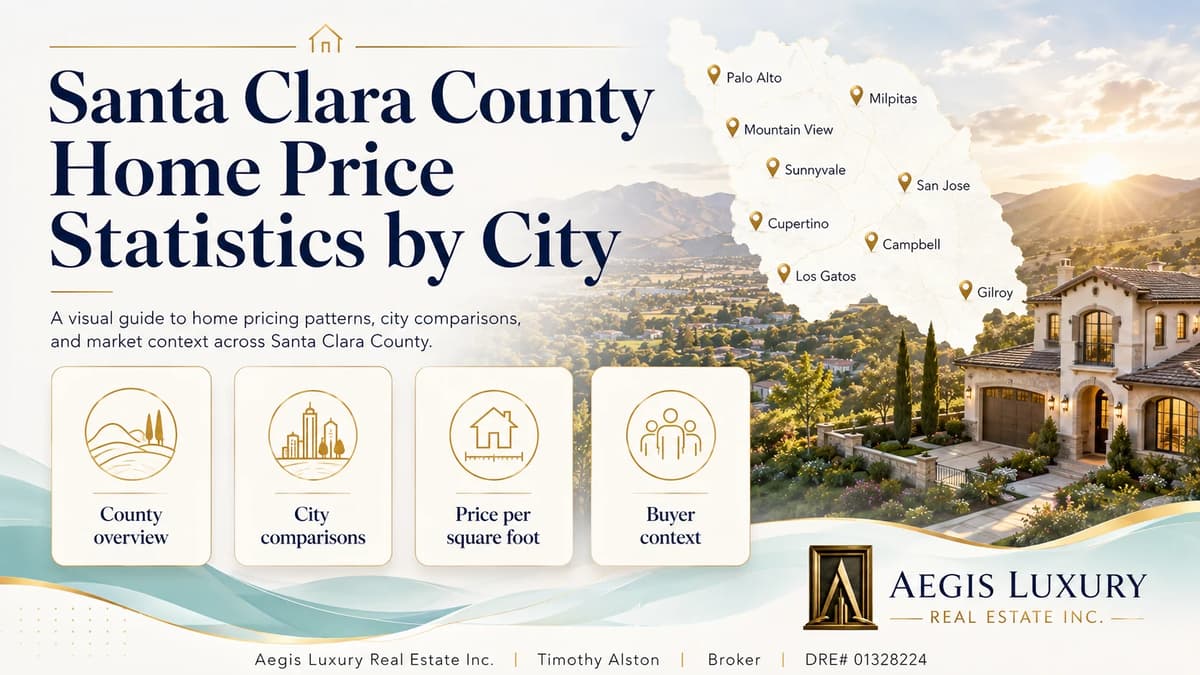
The two rankings disagree, and the disagreement is the useful part. Los Altos Hills carries the highest sale price in Santa Clara County but ranks third on price per square foot. Palo Alto carries the fifth highest sale price and ranks first per foot. What separates them is size: Los Altos Hills sells large homes, and the typical Palo Alto sale implies a smaller home at a higher rate per square foot of living area. A buyer comparing the two on sale price alone would conclude Los Altos Hills is the more expensive market. Per square foot of living area, it is not. Price per square foot here is sale price divided by living area, not a measure of land value.
| Rank by $/sq ft | City | Median price per sq ft | Rank by sale price | Shift |
|---|---|---|---|---|
| 1 | Palo Alto | $1,937 | 5 | +4 |
| 2 | Los Altos | $1,876 | 3 | +1 |
| 3 | Los Altos Hills | $1,580 | 1 | -2 |
| 4 | Cupertino | $1,504 | 6 | +2 |
| 5 | Saratoga | $1,494 | 4 | -1 |
| 6 | Monte Sereno | $1,471 | 2 | -4 |
| 7 | Sunnyvale | $1,263 | 9 | +2 |
| 8 | Los Gatos | $1,207 | 7 | -1 |
| 9 | Mountain View | $1,112 | 10 | +1 |
| 10 | Santa Clara | $1,092 | 11 | +1 |
| 11 | Campbell | $1,078 | 8 | -3 |
| 12 | San Jose | $878 | 12 | same |
| 13 | Milpitas | $800 | 14 | +1 |
| 14 | Morgan Hill | $632 | 13 | -1 |
| 15 | Gilroy | $524 | 15 | same |
| Santa Clara County | $969 |
Source: MLSListings Inc. closed residential transactions, trailing twelve months to August 11, 2026. Price per square foot computed as the median of closed price divided by living area, for sales where living area is greater than zero. Shift shows how far a city moves between the two rankings; a positive number means the city ranks higher per square foot than its sale price alone would suggest.
How Much House Does the Money Buy?
Dividing median sale price by median price per square foot gives an implied size benchmark. It is not the median size of a sold home, because the median of a ratio is not the ratio of medians. In Santa Clara County the benchmark runs from roughly 1,597 square feet in San Jose to 3,465 in Los Altos Hills.
| City | Median sale price | Median price per sq ft | Implied square feet |
|---|---|---|---|
| Los Altos Hills | $5,475,000 | $1,580 | 3,465 |
| Monte Sereno | $4,668,000 | $1,471 | 3,173 |
| Saratoga | $4,100,000 | $1,494 | 2,744 |
| Los Altos | $4,515,000 | $1,876 | 2,407 |
| Morgan Hill | $1,350,000 | $632 | 2,136 |
| Los Gatos | $2,577,500 | $1,207 | 2,135 |
| Gilroy | $1,100,000 | $524 | 2,099 |
| Cupertino | $3,055,000 | $1,504 | 2,031 |
| Palo Alto | $3,510,000 | $1,937 | 1,812 |
| Campbell | $1,920,000 | $1,078 | 1,781 |
| Mountain View | $1,852,500 | $1,112 | 1,666 |
| Milpitas | $1,315,000 | $800 | 1,644 |
| San Jose | $1,402,000 | $878 | 1,597 |
| Santa Clara | $1,690,000 | $1,092 | 1,548 |
| Sunnyvale | $1,865,000 | $1,263 | 1,477 |
| Santa Clara County | $1,648,944 | $969 | 1,702 |
Source: Derived by Aegis Luxury Real Estate from MLSListings Inc. median sale price and median price per square foot. This is an implied figure, not a median square footage. The median of a ratio is not the ratio of medians, so treat it as an indication of typical size rather than an exact measurement.
Where Do Santa Clara County Sales Actually Happen?
San Jose accounts for 5,175 of Santa Clara County's 10,536 closed sales, or 49.1%. The four most expensive cities combined account for 766, or 7.3%. San Jose alone closes 6.76 times the combined volume of the four most expensive cities, so the county median is set by the valley floor rather than the hills.
This is why the county median sits where it does. Half of every transaction in Santa Clara County happens in San Jose, so the county figure of $1,648,944 tracks San Jose at $1,402,000 far more closely than it tracks the luxury tier. The expensive cities dominate the headlines and contribute almost nothing to the middle of the distribution.
| City | Closed sales | Share of county | Active listings | Median sale price |
|---|---|---|---|---|
| San Jose | 5,175 | 49.1% | 1,161 | $1,402,000 |
| Sunnyvale | 794 | 7.5% | 105 | $1,865,000 |
| Santa Clara | 651 | 6.2% | 117 | $1,690,000 |
| Palo Alto | 530 | 5.0% | 61 | $3,510,000 |
| Mountain View | 498 | 4.7% | 88 | $1,852,500 |
| Morgan Hill | 443 | 4.2% | 108 | $1,350,000 |
| Los Gatos | 412 | 3.9% | 104 | $2,577,500 |
| Gilroy | 387 | 3.7% | 91 | $1,100,000 |
| Los Altos | 338 | 3.2% | 34 | $4,515,000 |
| Milpitas | 299 | 2.8% | 70 | $1,315,000 |
| Campbell | 281 | 2.7% | 79 | $1,920,000 |
| Saratoga | 278 | 2.6% | 53 | $4,100,000 |
| Cupertino | 257 | 2.4% | 62 | $3,055,000 |
| Los Altos Hills | 109 | 1.0% | 17 | $5,475,000 |
| Monte Sereno | 41 | 0.4% | 7 | $4,668,000 |
| Santa Clara County | 10,536 | 100.0% | 2,169 | $1,648,944 |
Source: MLSListings Inc. closed residential transactions, trailing twelve months to August 11, 2026. Active listing counts are a point in time snapshot at the run date, counting status Active only.
Monte Sereno recorded 41 closed sales in twelve months and Los Altos Hills 109. At that volume a handful of unusual transactions moves the median noticeably, and a figure that looks precise carries more uncertainty than the same figure would in San Jose. Aegis Luxury Real Estate reports these cities because the data supports it, and flags the sample size so the reader can weight it. Any city with fewer than 10 closed sales is not reported at all.
How These Santa Clara County Figures Are Calculated
Sale price and price per square foot come from MLSListings Inc. closed transaction records for the trailing twelve months, filtered to residential property, and are reported as medians rather than averages. Closed sale counts are transaction counts, active listings are a point in time snapshot, and the implied size benchmark, the ratios to the county median and the share of county volume are calculated by Aegis Luxury Real Estate from those records.
| Element | Definition |
|---|---|
| Source | MLSListings Inc., the multiple listing service covering Santa Clara County |
| Window | Trailing twelve months to August 11, 2026 |
| Property types | Single family residence, condominium, townhome |
| Excluded | Land, commercial, manufactured housing, income property, lease listings |
| Statistic | Sale price and price per square foot are medians computed server side across the full population of qualifying closed transactions. Counts, ratios, volume shares and the implied size benchmark are identified separately and are calculated by Aegis Luxury Real Estate |
| Price per square foot | Median of closed price divided by living area where living area is greater than zero |
| Implied square feet | Derived: median sale price divided by median price per square foot |
| Active listings | Status Active only, excluding pending and under contract, point in time |
| Minimum sample | Cities with fewer than 10 closed transactions are not reported |
Sale price, price per square foot, closed sale counts and the derived figures are calculated from MLSListings Inc. transaction records in the multiple listing service that Santa Clara County brokers use to list and sell homes. Active listing counts come from a point in time status snapshot of the same service. No figure on this page originates from a consumer portal, a commercial aggregator, or an automated valuation model.
Official Sources for Santa Clara County Market Data
Every figure on this page can be checked at its origin. These are the primary records, not summaries of them.
Using these figures
Journalists, researchers, students, and other sites are welcome to reproduce any statistic on this page. No permission is required. Please cite the page and link to the permanent URL so readers can check the figure against its source and see the current version.
Timothy Alston. "Santa Clara County Home Price Statistics by City." Aegis Luxury Real Estate, DRE# 01328224, updated August 11, 2026. https://aegishomesre.com/santa-clara-county-home-price-statistics/
https://aegishomesre.com/santa-clara-county-home-price-statistics/
This URL does not change. The page is updated in place rather than republished, so a link placed today continues to resolve to the current figures. For data questions, contact Timothy Alston at aegishomesre.com/contact.
Frequently Asked Questions
What is the median home price in Santa Clara County?
$1,648,944, calculated across 10,536 closed residential transactions in the trailing twelve months to August 11, 2026. Median price per square foot is $969. No individual city sits at the county median, so it is a poor guide to pricing a specific home.
Which Santa Clara County city is the most expensive?
Los Altos Hills, at a median sale price of $5,475,000. Monte Sereno follows at $4,668,000, Los Altos at $4,515,000 and Saratoga at $4,100,000. On price per square foot the answer changes: Palo Alto leads at $1,937.
Which Santa Clara County city is the least expensive?
Gilroy, at a median sale price of $1,100,000 and $524 per square foot. Milpitas follows at $1,315,000 and Morgan Hill at $1,350,000. Gilroy is one fifth the median price of Los Altos Hills and roughly one third its price per square foot.
Why does Palo Alto cost more per square foot than Los Altos Hills?
Because the two cities differ on size as well as rate. The Los Altos Hills implied size benchmark is roughly 3,465 square feet against 1,812 in Palo Alto. Los Altos Hills carries the higher total sale price, while Palo Alto carries the higher price per square foot of living area. Price per square foot here is sale price divided by living area, not a measure of land value.
Why is the Santa Clara County median so close to the San Jose median?
San Jose accounts for 5,175 of the county's 10,536 closed sales, or 49.1%. Half of every Santa Clara County transaction happens in San Jose, so the county median tracks San Jose at $1,402,000 far more closely than it tracks the four cities above $4,000,000, which together account for 7.3% of volume.
Why do these figures differ from the Aegis live market dashboard?
The live dashboard reports averages refreshed every fifteen minutes. This page reports medians across a fixed trailing twelve month window. In a county containing both Gilroy and Los Altos Hills, a small number of very large sales pull an average well above the median. Both measures are correct and they answer different questions.

Timothy Alston
Timothy Alston is a licensed California real estate Broker serving all 15 cities of Santa Clara County. This reference page is maintained as part of an ongoing statistical series and is updated in place when its source data or methodology materially changes.