Wildfire Statistics: California and the United States

Wildfire ranks seventh of FEMA's eighteen tracked hazards by expected annual loss in the United States, at $3.9 billion per year, or 2.54% of the national total. In California, the state most associated with wildfire, it ranks third at $1.79 billion, behind earthquake at 49.19% and inland flooding at 38.62%. California carries 45.9% of all United States wildfire expected annual loss.
Key Wildfire Statistics
FEMA National Risk Index v1.20- Wildfire accounts for $3,894,485,335 in expected annual loss across the United States. (FEMA NRI v1.20)
- Wildfire ranks 7th of FEMA's 18 tracked hazards, at 2.54% of national expected annual loss. (FEMA NRI v1.20)
- Inland flooding causes 16.8 times more expected annual loss than wildfire nationally. (FEMA NRI v1.20)
- California carries $1,787,365,372 in wildfire expected annual loss, 45.9% of the United States total. (FEMA NRI v1.20)
- Within California, wildfire is only 5.92% of the state's expected annual loss. Earthquake is 49.19%. (FEMA NRI v1.20)
- San Diego County carries the highest wildfire expected annual loss of any United States county at $430,155,987. (FEMA NRI v1.20)
- Seven of the ten highest wildfire loss counties in the United States are in California. (FEMA NRI v1.20)
- The top 10 counties account for 36.4% of all United States wildfire expected annual loss. (FEMA NRI v1.20)
- Elko County, Nevada derives 82.6% of its total expected annual loss from wildfire, the highest concentration in the country. (FEMA NRI v1.20)
- 3,143 of 3,232 United States counties carry some wildfire expected annual loss. (FEMA NRI v1.20)
Where Does Wildfire Rank Among United States Hazards?
Seventh, at $3,894,485,335 in expected annual loss, or 2.54% of the national total. Inland flooding ranks first at $65.3 billion, or 42.49%.
Wildfire's prominence in public discussion is not reflected in FEMA's modeled loss ranking: it ranks seventh of eighteen hazards nationally. FEMA tracks eighteen natural hazards and calculates expected annual loss for each, combining building damage, population impact converted to dollars, and agricultural loss. On that measure wildfire sits behind inland flooding, earthquake, hurricane, tornado, cold wave and heat wave. Cold wave alone causes more than twice the expected annual loss of wildfire.
| Rank | Hazard | Expected annual loss | Share of national total |
|---|---|---|---|
| 1 | Inland flooding | $65,272,047,117 | 42.49% |
| 2 | Earthquake | $26,480,618,973 | 17.24% |
| 3 | Hurricane | $14,200,292,594 | 9.24% |
| 4 | Tornado | $11,546,535,380 | 7.52% |
| 5 | Cold wave | $9,878,061,176 | 6.43% |
| 6 | Heat wave | $7,125,365,075 | 4.64% |
| 7 | Wildfire | $3,894,485,335 | 2.54% |
| 8 | Hail | $3,202,409,654 | 2.08% |
| 9 | Strong wind | $3,180,653,607 | 2.07% |
| 10 | Drought | $2,678,231,827 | 1.74% |
| All 18 hazards | $153,608,237,127 | 100.00% |
Source: FEMA National Risk Index state table, v1.20, December 2025. Computed by Aegis Luxury Real Estate by summing each hazard's expected annual loss across all fifty six states and territories. The eighteen hazard totals sum exactly to the composite figure.
Wildfire is visible, photogenic, and produces total losses on individual structures. Inland flooding is diffuse, repetitive, and damages far more buildings partially rather than a smaller number completely. Expected annual loss counts dollars, not headlines. A hazard that destroys two thousand homes in one week ranks below one that damages two hundred thousand homes a little at a time across a year.
How Much of United States Wildfire Risk Is in California?
California carries $1,787,365,372 in wildfire expected annual loss, which is 45.9% of the United States total. The next state, Arizona, carries 5.9%.
Wildfire is highly geographically concentrated. California alone carries nearly half of the national total, and the gap between first and second place is nearly eightfold.
| Rank | State | Wildfire expected annual loss | Share of US wildfire | Share of that state's total loss |
|---|---|---|---|---|
| 1 | California | $1,787,365,372 | 45.9% | 5.9% |
| 2 | Arizona | $228,349,137 | 5.9% | 6.3% |
| 3 | Colorado | $211,174,415 | 5.4% | 10.1% |
| 4 | Utah | $197,181,712 | 5.1% | 12.8% |
| 5 | Washington | $173,105,718 | 4.4% | 3.7% |
| 6 | Nevada | $156,551,580 | 4.0% | 11.4% |
| 7 | Idaho | $142,875,391 | 3.7% | 19.4% |
| 8 | Oregon | $126,341,823 | 3.2% | 5.0% |
| 9 | Texas | $126,057,441 | 3.2% | 1.0% |
| 10 | New Mexico | $113,131,349 | 2.9% | 11.6% |
| 11 | Florida | $111,787,038 | 2.9% | 1.3% |
| 12 | Montana | $72,702,274 | 1.9% | 9.6% |
| United States | $3,894,485,335 | 100.0% | 2.5% |
Source: FEMA National Risk Index state table, v1.20, December 2025.
California leads on absolute wildfire loss but wildfire is only 5.9% of California's own expected annual loss. Idaho ranks seventh in absolute terms, yet wildfire accounts for 19.4% of everything Idaho expects to lose. Utah is 12.8%, Nevada 11.4%, New Mexico 11.6%. Wildfire dominates the risk picture in the interior west in a way it does not in California, where earthquake and flooding are far larger. Ranking states by absolute wildfire loss and ranking them by wildfire exposure produce different answers.

Is Wildfire California's Biggest Hazard?
No. Wildfire is California's third largest hazard at 5.92% of state expected annual loss. Earthquake is first at 49.19% and inland flooding second at 38.62%.
This is the figure most at odds with public perception. California expects to lose $14,853,246,588 per year to earthquake and $11,662,338,119 to inland flooding, against $1,787,365,372 to wildfire. Earthquake and flooding together account for 87.81% of California's expected annual loss. Wildfire, drought and every other hazard share the remaining twelve percent.
| Rank | Hazard | Expected annual loss | Share of California total |
|---|---|---|---|
| 1 | Earthquake | $14,853,246,588 | 49.19% |
| 2 | Inland flooding | $11,662,338,119 | 38.62% |
| 3 | Wildfire | $1,787,365,372 | 5.92% |
| 4 | Drought | $1,001,607,226 | 3.32% |
| 5 | Heat wave | $378,344,655 | 1.25% |
| 6 | Tsunami | $192,310,068 | 0.64% |
| 7 | Landslide | $130,054,025 | 0.43% |
| 8 | Coastal flooding | $67,271,833 | 0.22% |
| California, all hazards | $30,194,921,299 | 100.00% |
Source: FEMA National Risk Index state table, v1.20, December 2025. California carries the highest total expected annual loss of any state, with an expected annual loss score of 100.0.
Which Counties Carry the Most Wildfire Risk?
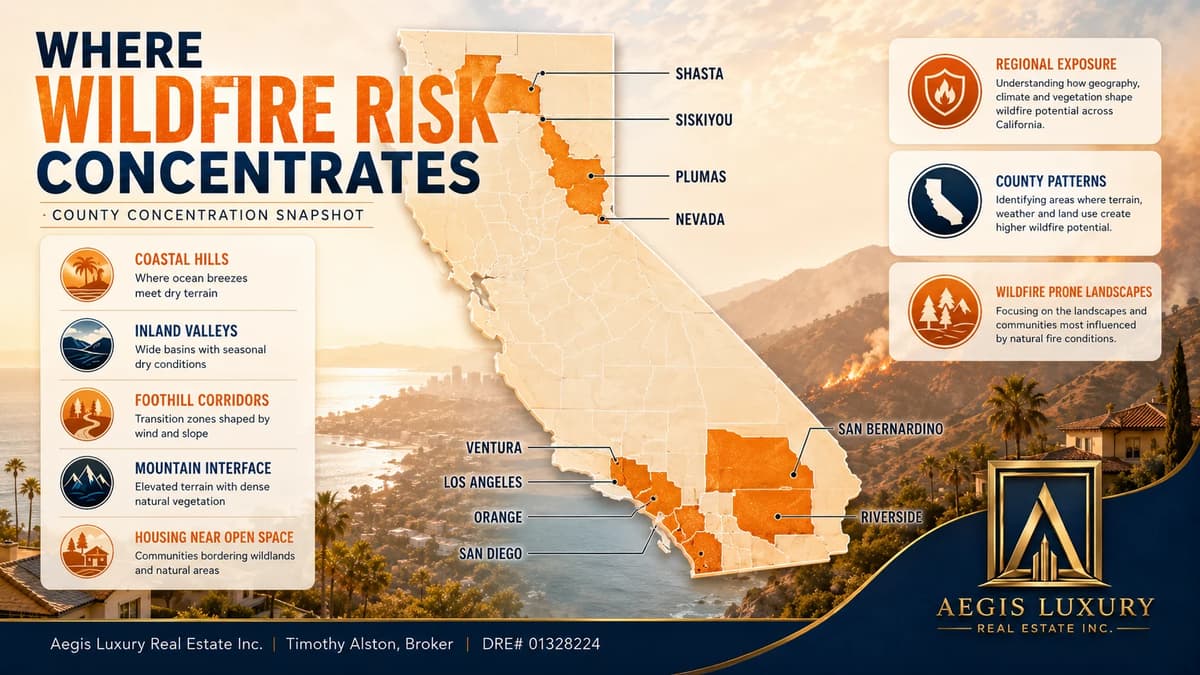
San Diego County, California, at $430,155,987 in wildfire expected annual loss. Riverside County follows at $346,642,805. Seven of the top ten are in California.
| Rank | County | Wildfire expected annual loss | Share of that county's total loss |
|---|---|---|---|
| 1 | San Diego, CA | $430,155,987 | 27.9% |
| 2 | Riverside, CA | $346,642,805 | 15.3% |
| 3 | Los Angeles, CA | $155,191,812 | 2.0% |
| 4 | San Bernardino, CA | $145,737,649 | 7.0% |
| 5 | Washington, UT | $67,561,249 | 45.8% |
| 6 | Elko, NV | $61,636,633 | 82.6% |
| 7 | Orange, CA | $57,585,624 | 3.0% |
| 8 | El Dorado, CA | $55,205,076 | 44.4% |
| 9 | Ventura, CA | $50,107,804 | 6.6% |
| 10 | Jefferson, CO | $48,732,848 | 21.1% |
Source: FEMA National Risk Index county table, v1.20, December 2025, covering 3,232 county and county equivalent rows.
San Diego County carries the largest absolute wildfire loss in the United States, and wildfire is 27.9% of its total risk. Los Angeles County ranks third in absolute terms, but wildfire is only 2.0% of what Los Angeles expects to lose, because earthquake and flooding dominate there. At the other extreme, Elko County, Nevada derives 82.6% of its entire expected annual loss from wildfire. A county can rank high because it has a great deal of everything, or because wildfire is nearly the only hazard it faces. Those are different situations and a ranking by dollars alone does not separate them.
How Concentrated Is Wildfire Risk?
Extremely. The top 10 counties account for 36.4% of all United States wildfire expected annual loss, and California's 58 counties account for 45.9%.
Wildfire expected annual loss appears in 3,143 of the 3,232 county rows FEMA publishes, so almost everywhere carries some exposure. The distribution is what matters. Ten counties out of more than three thousand hold better than a third of the national total, and one state holds nearly half. The wildfire distribution is unusually concentrated: California holds 45.9% of modeled national wildfire loss and the top ten counties hold 36.4%. Inland flooding, by contrast, is spread across every populated river basin in the country.
| Measure | Value |
|---|---|
| National wildfire expected annual loss | $3,894,485,335 |
| Rank among 18 tracked hazards | 7th |
| Share of national expected annual loss | 2.54% |
| Counties carrying any wildfire loss | 3,143 of 3,232 |
| Share held by the top 10 counties | 36.4% |
| Share held by California | 45.9% |
| Highest single county | San Diego, CA |
| Highest wildfire share of a county's own risk | Elko, NV, 82.6% |
Source: FEMA National Risk Index county and state tables, v1.20, December 2025. Concentration figures computed by Aegis Luxury Real Estate from the published county table.
How These Figures Are Calculated
Every figure comes from FEMA's National Risk Index version 1.20, released December 2025. Nothing on this page is drawn from a news account, an insurance industry estimate, or a commercial data aggregator.
| Element | Definition |
|---|---|
| Source | FEMA National Risk Index, county and state tables, version 1.20 |
| Released | December 2025 |
| Coverage | 3,232 county and county equivalent rows, 56 states and territories |
| Expected annual loss | Modeled long run average annual loss, combining building damage, population impact converted to dollars, and agricultural loss |
| Dollar basis | Inflation adjusted to December 2024 dollars |
| Hazard count | 18 tracked natural hazards |
| Aggregation | National and state hazard totals summed by Aegis Luxury Real Estate from the published tables. The 18 hazard totals reconcile exactly to the composite figure. |
It is a modeled long run average, not a forecast for any single year. A year with no major wildfire and a year with several both sit inside the same expected annual loss figure. It is also not a measure of acres burned, ignitions, or fire frequency. It measures dollars of expected damage, which depends as much on what has been built in the hazard path as on the hazard itself. A large fire in unpopulated terrain contributes almost nothing to expected annual loss.
Official Sources for United States Wildfire Data
Every figure on this page can be checked at its origin. These are the primary records, not summaries of them.
Using these figures
Journalists, researchers, students, and other sites are welcome to reproduce any statistic on this page. No permission is required. Please cite the page and link to the permanent URL so readers can check the figure against its source and see the current version.
Timothy Alston. "Wildfire Statistics: California and the United States." Aegis Luxury Real Estate, DRE# 01328224, updated August 17, 2026. https://aegishomesre.com/wildfire-statistics/
https://aegishomesre.com/wildfire-statistics/
This URL does not change. The page is updated in place rather than republished, so a link placed today continues to resolve to the current figures. For data questions, contact Timothy Alston at aegishomesre.com/contact.
Frequently Asked Questions
How much damage does wildfire cause in the United States each year?
FEMA calculates $3,894,485,335 in expected annual loss from wildfire across the United States under National Risk Index version 1.20. That is a modeled long run average combining building damage, population impact converted to dollars, and agricultural loss. It is not a forecast for any single year.
Is wildfire the biggest natural hazard in the United States?
No. Wildfire ranks seventh of FEMA's eighteen tracked hazards at 2.54% of national expected annual loss. Inland flooding ranks first at 42.49%, earthquake second at 17.24%, and hurricane third at 9.24%. Inland flooding causes roughly 16.8 times more expected annual loss than wildfire.
Is wildfire California's biggest hazard?
No. Wildfire is California's third largest hazard at 5.92% of state expected annual loss. Earthquake is first at 49.19% and inland flooding second at 38.62%. Together those two account for 87.81% of what California expects to lose annually.
Which state has the most wildfire risk?
California, at $1,787,365,372 in wildfire expected annual loss, or 45.9% of the United States total. Arizona is a distant second at 5.9%. Measured differently, as wildfire's share of a state's own total risk, Idaho leads at 19.4%, followed by Utah at 12.8% and New Mexico at 11.6%. California is only 5.9% by that measure.
Which county has the most wildfire risk?
San Diego County, California, at $430,155,987 in wildfire expected annual loss, where wildfire accounts for 27.9% of total county risk. Riverside County follows at $346,642,805. Seven of the ten highest wildfire loss counties in the United States are in California. Elko County, Nevada has the highest concentration, deriving 82.6% of its entire expected annual loss from wildfire.
Does expected annual loss measure acres burned?
No. Expected annual loss measures dollars of expected damage, which depends on what has been built in the hazard path as much as on the hazard itself. A large fire in unpopulated terrain contributes almost nothing to expected annual loss, while a smaller fire in a dense wildland urban interface contributes a great deal.

Timothy Alston
Timothy Alston is a licensed California real estate Broker serving Santa Clara, San Mateo, Santa Cruz and Monterey counties. This reference page is maintained as part of an ongoing statistical series and is updated in place when its source data or methodology materially changes.