California House Fire Statistics

California residential structure fires produce 3.5 deaths per 1,000 fires against a national average of 5.8. California's home fire death rate is 40% below the national figure, and its all-fire death rate of 1.0 per 1,000 is 52% below the national 2.1. The reversal is in vehicles: 40.3% of California fire deaths occur in vehicle fires against 22.7% nationally.
Key California House Fire Statistics
USFA National Fire Incident Reporting System, 2023- California residential structure fires produce 3.5 deaths per 1,000 fires. (USFA NFIRS)
- The national average is 5.8 deaths per 1,000 residential structure fires, so California runs 40% below it. (USFA NFIRS)
- California residential structure fires produce 14.5 injuries per 1,000 fires against a national 19.7. (USFA NFIRS)
- Across all fire types California records 1.0 death per 1,000 fires against a national 2.1. (USFA NFIRS)
- 40.3% of California fire deaths occur in vehicle fires, nearly double the national 22.7%. (USFA NFIRS)
- Only 43.1% of California fire deaths occur in residential structures against 68.3% nationally. (USFA NFIRS)
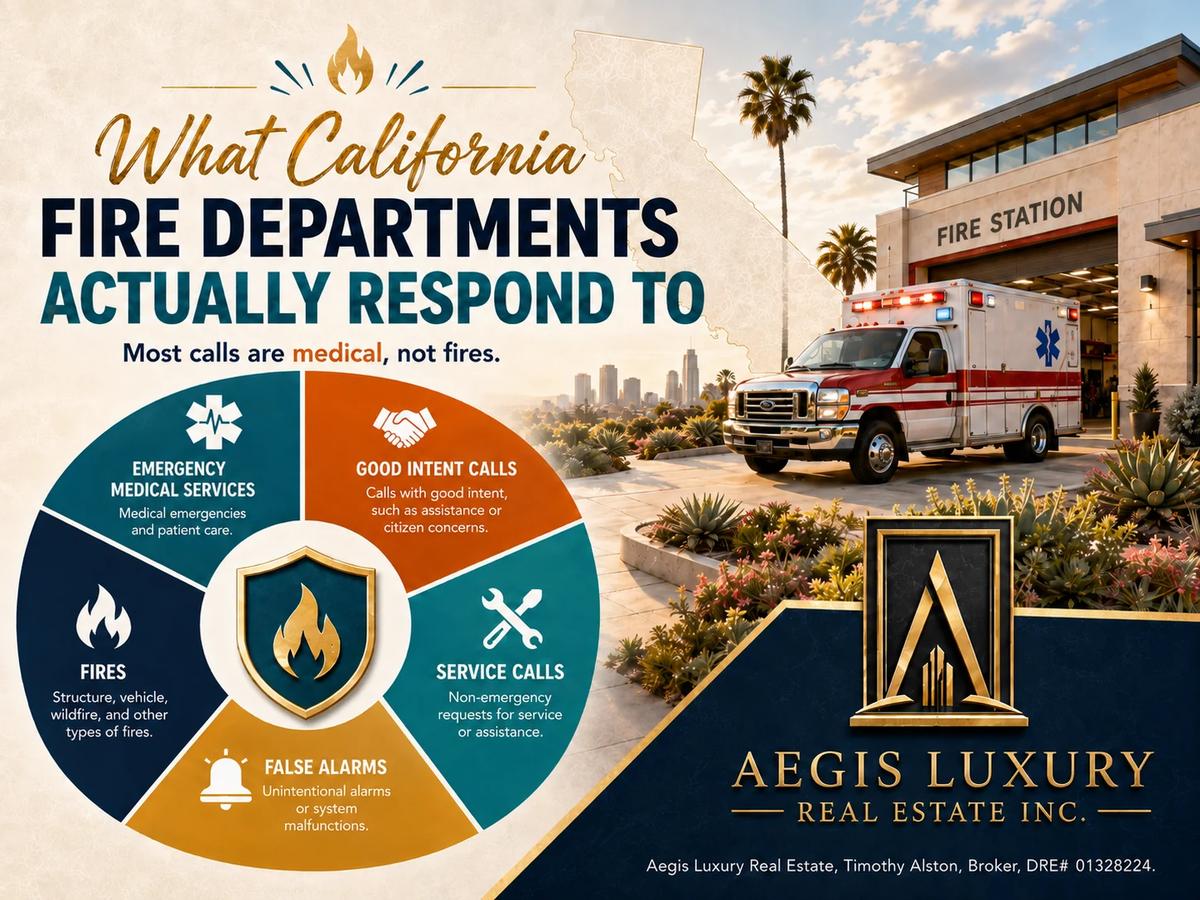
- Fires account for just 4.0% of California fire department calls. 66.7% are emergency medical service calls. (USFA NFIRS)
- 562 California fire departments reported to the National Fire Incident Reporting System in 2023. (USFA NFIRS)
- Wildfire accounts for 5.92% of California's expected annual loss, well behind earthquake and inland flooding. (FEMA NRI v1.20)
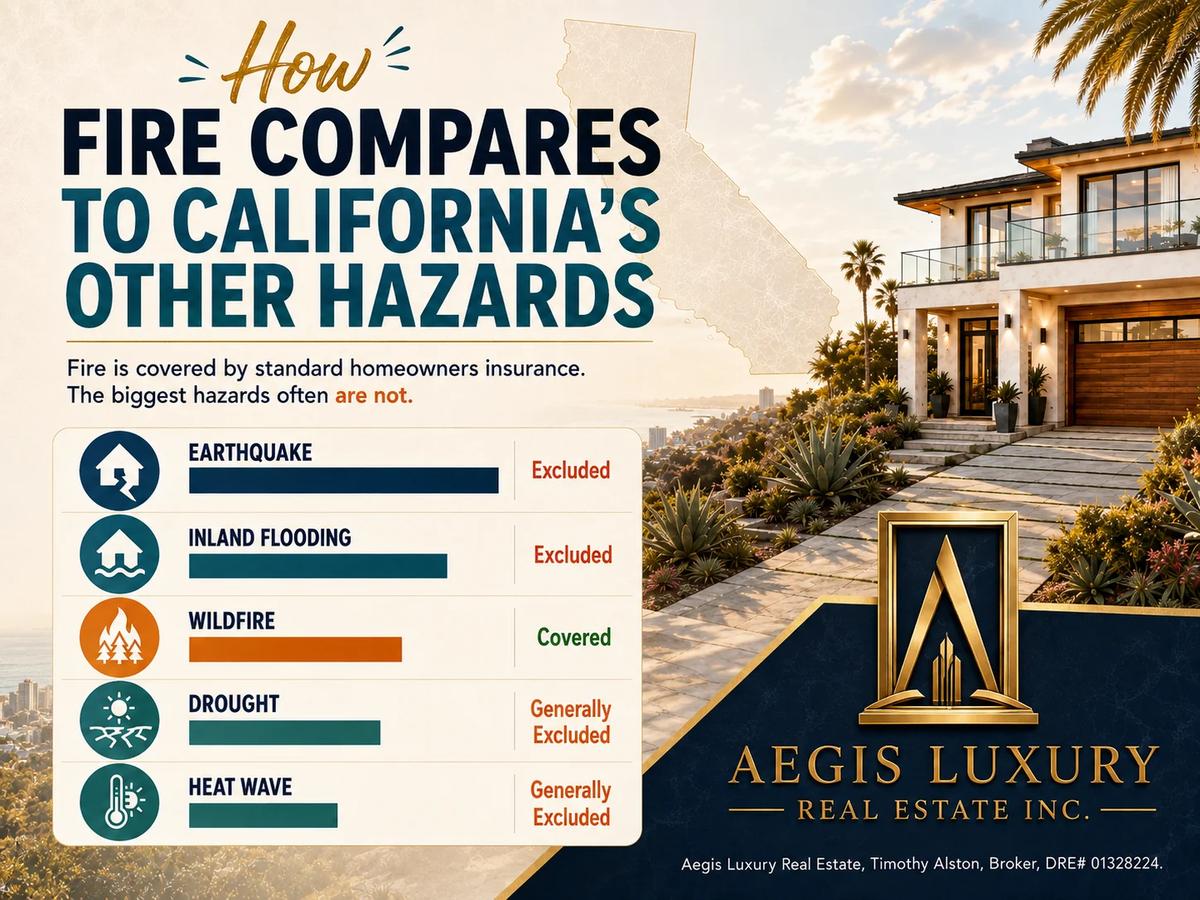
- Fire damage is covered by a standard California homeowners policy. Earthquake and flood, the two larger hazards, are not. (CDI, FEMA NRI)
How Deadly Are House Fires in California?
Less deadly than the national average, by a wide margin. California residential structure fires produce 3.5 deaths per 1,000 fires against a national average of 5.8, and 14.5 injuries against 19.7.
This is the opposite of what most coverage of California fire risk implies. On the measure that matters most, deaths per thousand residential fires, California performs substantially better than the country as a whole. The gap holds on injuries as well, and it widens when all fire types are included.
| Fire type | California deaths per 1,000 | National deaths per 1,000 | California injuries per 1,000 | National injuries per 1,000 |
|---|---|---|---|---|
| All fires | 1.0 | 2.1 | 2.7 | 6.4 |
| Residential structure fires | 3.5 | 5.8 | 14.5 | 19.7 |
Source: U.S. Fire Administration, California fire loss and fire department profile, drawn from the National Fire Incident Reporting System, 2023 data. Rates are per 1,000 reported fires, not per capita.
California is the most populous state, so any raw count of fires, deaths or dollar loss will be among the highest in the country by construction. That tells a reader nothing about risk. A rate per thousand fires answers the question a homeowner is actually asking: if a fire happens here, how bad is it likely to be. On that measure California sits well below the national average, and reporting that uses raw counts instead of rates produces the opposite impression.
Where Do California Fire Deaths Actually Happen?
In vehicles far more often than nationally. 40.3% of California fire deaths occur in vehicle fires against 22.7% nationally, while only 43.1% occur in residential structures against 68.3% nationally.
| Incident type | California share of deaths | National share of deaths | California share of injuries | National share of injuries |
|---|---|---|---|---|
| Structures | 50.7% | 73.1% | 77.3% | 83.8% |
| Residential structures | 43.1% | 68.3% | 67.7% | 74.5% |
| Vehicles | 40.3% | 22.7% | 13.1% | 8.8% |
| Outside fires | 6.9% | 3.0% | 9.1% | 5.6% |
Source: U.S. Fire Administration, California fire loss and fire department profile, NFIRS 2023 data. Structures include residential and nonresidential buildings, so the structures row includes the residential structures row. Columns are shares of California casualties and do not sum to 100 percent across the categories shown.
California's residential fire death rate is 40 percent below the national average, and the share of California fire deaths occurring in homes is 25 percentage points below the national share. Both point the same direction. Where California diverges sharply is vehicles, which account for nearly twice the share of fire deaths they do nationally. Outside fires account for 6.9 percent of California fire deaths against 3.0 percent nationally, and 34.8 percent of California firefighter injuries against 14.1 percent, which is where the wildland exposure appears in this dataset.
How Often Do California Fire Departments Respond to Fires?
Rarely. Fires account for 4.0% of California fire department calls. Emergency medical service calls account for 66.7%.
Two thirds of what a California fire department does is medical response. The pattern is close to the national picture and it is worth stating plainly because it reframes what a fire department is. Fire suppression is a small share of the call volume in California and in the country as a whole.
| Incident type | California share of calls | National share of calls |
|---|---|---|
| Emergency medical services | 66.7% | 65.2% |
| Good intent calls | 15.7% | 11.5% |
| Service calls | 6.2% | 7.6% |
| False alarms | 5.2% | 7.8% |
| Fires | 4.0% | 3.9% |
| Hazardous conditions | 1.8% | 3.0% |
| Other | 0.3% | 0.8% |
| Weather | 0.1% | 0.2% |
| Explosions | 0.1% | 0.1% |
| Reporting departments | 562 |
Source: U.S. Fire Administration, California fire loss and fire department profile, NFIRS 2023 data. Percentages may not total 100 due to rounding. 562 California fire departments reported NFIRS data in 2023. NFIRS participation is voluntary, so the reporting set is not every department in the state.
How Does Fire Compare to California's Other Hazards?
Fire is the hazard a standard homeowners policy actually covers, and it is not the largest one California faces. Wildfire accounts for 5.92% of California's expected annual loss. Earthquake accounts for 49.19% and inland flooding for 38.62%.
The two hazards responsible for 87.81 percent of California's modeled annual loss are both excluded from a standard homeowners policy and must be purchased separately. Fire, the smaller exposure by this measure, is the one included. That is the structural fact behind California's insurance conversation, and it is why fire statistics and insurance statistics have to be read together rather than separately.
| Hazard | Share of California expected annual loss | Standard homeowners policy |
|---|---|---|
| Earthquake | 49.19% | Excluded |
| Inland flooding | 38.62% | Excluded |
| Wildfire | 5.92% | Covered |
| Drought | 3.32% | Generally excluded |
| Heat wave | 1.25% | Generally excluded |
Source: FEMA National Risk Index state table, v1.20, December 2025. Expected annual loss is a modeled long run average and includes structure fire only insofar as it falls within the wildfire hazard. It is not directly comparable to NFIRS incident counts, which record reported fires of all kinds.
How These Figures Are Calculated
Fire casualty and incident figures come from the U.S. Fire Administration's National Fire Incident Reporting System. Hazard shares come from the FEMA National Risk Index. No figure comes from a trade association survey, an insurance industry estimate, or a news account.
| Element | Definition |
|---|---|
| Fire data source | U.S. Fire Administration, National Fire Incident Reporting System, 2023 data |
| Reporting basis | Voluntary. 562 California fire departments reported in 2023. |
| Casualty rates | Deaths and injuries per 1,000 reported fires, not per capita |
| Residential structure | Residential buildings only. The structures category includes nonresidential buildings. |
| Hazard shares | FEMA National Risk Index state table, version 1.20, December 2025 |
| Not included | No NFPA survey estimates, no insurance industry loss figures, no county or city level fire data |
| Geographic level | State and national. USFA does not publish county level casualty rates in this profile. |
Aegis Luxury Real Estate reports the federal incident record rather than a trade association survey. The two are not the same and produce different numbers. NFIRS is a census of incidents reported by participating departments. Survey estimates extrapolate from a sample.
Official Sources for California Fire Data
Every figure on this page can be checked at its origin. These are the primary agency records, not summaries of them.
Using these figures
Journalists, researchers, students, and other sites are welcome to reproduce any statistic on this page. No permission is required. Please cite the page and link to the permanent URL so readers can check the figure against its source and see the current version.
Timothy Alston. "California House Fire Statistics." Aegis Luxury Real Estate, DRE# 01328224, updated August 17, 2026. https://aegishomesre.com/house-fire-statistics/
https://aegishomesre.com/house-fire-statistics/
This URL does not change. The page is updated in place rather than republished, so a link placed today continues to resolve to the current figures. For data questions, contact Timothy Alston at aegishomesre.com/contact.
Frequently Asked Questions
How many people die in house fires in California?
California residential structure fires produce 3.5 deaths per 1,000 fires, against a national average of 5.8. California's home fire death rate is roughly 40 percent below the national figure. Injuries follow the same pattern at 14.5 per 1,000 against a national 19.7.
Is California more dangerous for house fires than other states?
No, less dangerous by this measure. Across all fire types California records 1.0 death per 1,000 fires against a national average of 2.1. California is the most populous state, so raw counts of fires and deaths are high by construction, but the rate per thousand fires sits well below the national average.
Where do most fire deaths occur in California?
Residential structures account for 43.1 percent of California fire deaths, well below the national 68.3 percent. Vehicle fires account for 40.3 percent in California against 22.7 percent nationally, nearly double the national share. Outside fires account for 6.9 percent against 3.0 percent nationally.
How much of a fire department's work is actually fires?
About 4.0 percent of California fire department calls are fires. Emergency medical service calls account for 66.7 percent, good intent calls 15.7 percent, service calls 6.2 percent and false alarms 5.2 percent. The national pattern is very similar.
Does homeowners insurance cover fire damage in California?
Yes. Fire is the hazard a standard California homeowners policy covers. Earthquake and flood are excluded and purchased separately, and those two account for 87.81 percent of California's expected annual loss under the FEMA National Risk Index. Where private fire coverage is unavailable, the California FAIR Plan provides a limited fire policy.
Where does this fire data come from?
The U.S. Fire Administration's National Fire Incident Reporting System, 2023 data, as published in the USFA California state profile. 562 California fire departments reported in 2023. NFIRS participation is voluntary, so the reporting set is not every department in the state. These are federal incident records rather than trade association survey estimates, and the two produce different numbers.

Timothy Alston
Timothy Alston is a licensed California real estate Broker serving all 15 cities of Santa Clara County. This reference page is maintained as part of an ongoing statistical series and is updated in place when its source data or methodology materially changes.