Santa Clara County Housing Inventory Statistics
Santa Clara County holds 2,169 active listings against 10,536 closed sales in the trailing twelve months, roughly 2.5 months of supply. Every one of the fifteen cities sits below 3.5 months against the six-month balance benchmark. Los Altos is tightest at 1.2 months; San Jose holds 53.5% of all county inventory.
Key Santa Clara County Housing Inventory Statistics
MLSListings Inc. closed data- Santa Clara County held 2,169 active residential listings as of August 11, 2026. (MLSListings Inc.)
- The county closed 10,536 residential sales in the trailing twelve months, a pace of roughly 878 per month. (MLSListings Inc.)
- That works out to roughly 2.5 months of supply, against the six month benchmark for a balanced market. (MLSListings Inc.)
- Every one of Santa Clara County’s fifteen cities sits below 3.5 months of supply. (MLSListings Inc.)
- Los Altos is the tightest market in Santa Clara County at roughly 1.2 months, with 34 active listings against 338 annual closings. (MLSListings Inc.)
- Palo Alto and Sunnyvale follow at roughly 1.4 and 1.6 months. (MLSListings Inc.)
- Campbell carries the loosest supply at roughly 3.4 months, still well inside seller’s market territory. (MLSListings Inc.)
- San Jose holds 1,161 active listings, 53.5% of all inventory in Santa Clara County, while producing 49.1% of its closings. (MLSListings Inc.)
- Monte Sereno is the smallest market in the county with 7 active listings. (MLSListings Inc.)
How Many Homes Are for Sale in Santa Clara County?
Santa Clara County held 2,169 active residential listings as of August 11, 2026, against 10,536 closed sales in the trailing twelve months.
Active means available: listings in Active status only, excluding everything already pending or under contract. Set against a closing pace of roughly 878 sales per month, the standing inventory represents about 2.5 months of supply. If no new listing appeared, the county would sell through its entire available stock in under eleven weeks.
| Measure | Value | Detail |
|---|---|---|
| Active listings | 2,169 | Snapshot as of August 11, 2026 |
| Closed sales, trailing twelve months | 10,536 | Roughly 878 per month |
| Months of supply | 2.5 | Derived: active divided by monthly pace |
| Tightest city | 1.2 | Los Altos |
| Loosest city | 3.4 | Campbell |
Source: MLSListings Inc., active listing snapshot and closed transactions, trailing twelve months to August 11, 2026.
How Much Inventory Does Each Santa Clara County City Hold?
San Jose holds 1,161 of the county's 2,169 active listings. No other Santa Clara County city holds more than 117, and four cities hold fewer than 60.
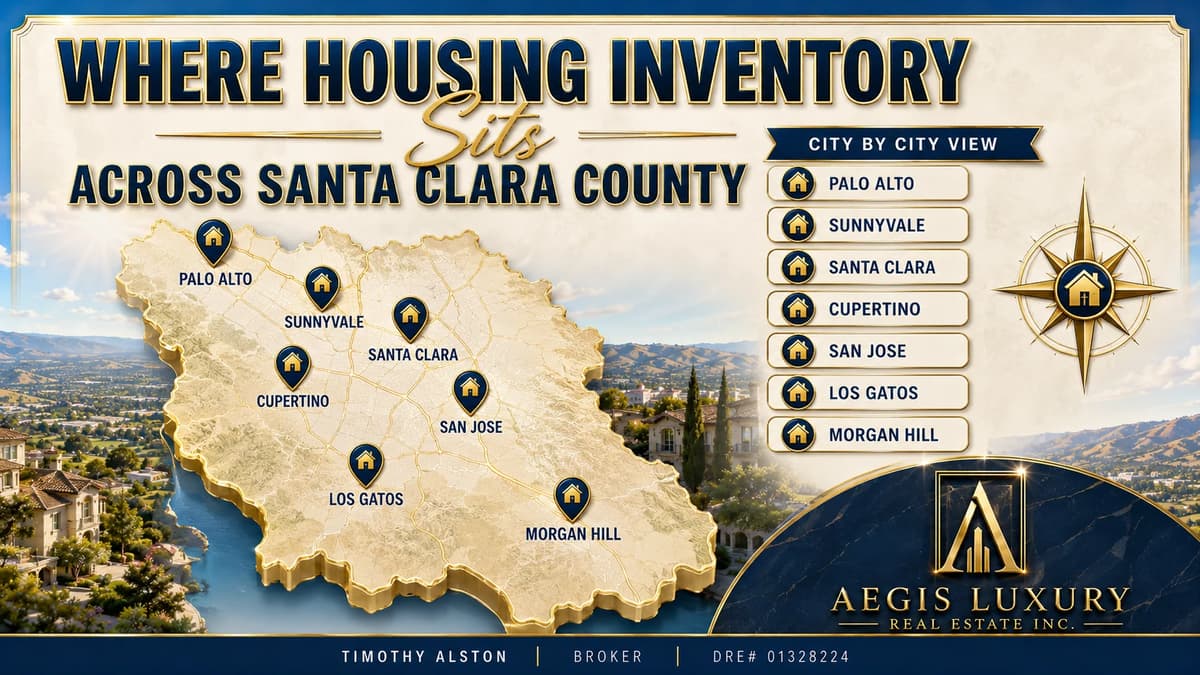
| City | Active listings | Closed sales, 12 mo | Months of supply | Median days on market |
|---|---|---|---|---|
| San Jose | 1,161 | 5,175 | 2.7 | 13 |
| Santa Clara | 117 | 651 | 2.2 | 11 |
| Morgan Hill | 108 | 443 | 2.9 | 15 |
| Sunnyvale | 105 | 794 | 1.6 | 9 |
| Los Gatos | 104 | 412 | 3.0 | 13 |
| Gilroy | 91 | 387 | 2.8 | 22 |
| Mountain View | 88 | 498 | 2.1 | 9 |
| Campbell | 79 | 281 | 3.4 | 11 |
| Milpitas | 70 | 299 | 2.8 | 13 |
| Cupertino | 62 | 257 | 2.9 | 9 |
| Palo Alto | 61 | 530 | 1.4 | 9 |
| Saratoga | 53 | 278 | 2.3 | 11 |
| Los Altos | 34 | 338 | 1.2 | 8 |
| Los Altos Hills | 17 | 109 | 1.9 | 14 |
| Monte Sereno | 7 | 41 | 2.0 | 13 |
Source: MLSListings Inc., snapshot and trailing twelve months to August 11, 2026. Months of supply is derived; see methodology.
Which Santa Clara County City Has the Tightest Housing Supply?
Los Altos, at roughly 1.2 months of supply, holding 34 active listings against 338 annual closings. Palo Alto follows at 1.4 months and Sunnyvale at 1.6. Campbell at 3.4 months carries 2.8 times the supply of Los Altos at 1.2, and even the loosest city sits below the six month balance benchmark.
Supply and speed tell one story. The three tightest cities by supply are also among the county's fastest moving markets, each posting a median of 9 days or fewer. At the other end, Campbell at 3.4 months and Los Gatos at 3.0 give buyers measurably more standing choice, and both still clear the six-month balance test with room to spare.
| City | Months of supply | Active listings | Median days on market |
|---|---|---|---|
| Los Altos | 1.2 | 34 | 8 |
| Palo Alto | 1.4 | 61 | 9 |
| Sunnyvale | 1.6 | 105 | 9 |
| Los Altos Hills | 1.9 | 17 | 14 |
| Monte Sereno | 2.0 | 7 | 13 |
| Mountain View | 2.1 | 88 | 9 |
| Santa Clara | 2.2 | 117 | 11 |
| Saratoga | 2.3 | 53 | 11 |
| San Jose | 2.7 | 1,161 | 13 |
| Milpitas | 2.8 | 70 | 13 |
| Gilroy | 2.8 | 91 | 22 |
| Cupertino | 2.9 | 62 | 9 |
| Morgan Hill | 2.9 | 108 | 15 |
| Los Gatos | 3.0 | 104 | 13 |
| Campbell | 3.4 | 79 | 11 |
Source: MLSListings Inc., trailing twelve months to August 11, 2026. Speed analysis on the Santa Clara County days on market statistics page.
How Much of Santa Clara County Inventory Sits in San Jose?
53.5%. San Jose holds 1,161 of the county's 2,169 active listings while producing 49.1% of its closings, 5,175 of 10,536. Its 53.5% inventory share runs 4.4 points above its 49.1% closing share.
San Jose carries a slightly larger share of the county's standing inventory than of its sales, which is why its months of supply, at roughly 2.7, runs above the county figure of 2.5. A buyer who wants standing choice in Santa Clara County is, in practice, mostly choosing among San Jose listings. A buyer targeting the west valley or the Los Altos corridor is competing for a rotating stock of a few dozen homes per city.
San Jose accounts for nearly half of Santa Clara County closings, 5,175 of 10,536, and holds more active inventory than the other fourteen cities combined, 1,161 against 1,008. County-level statistics are, to a first approximation, San Jose statistics with a premium tail.
Is Santa Clara County a Buyer’s or Seller’s Market?
By the standard inventory measure, a seller’s market throughout. Every one of the fifteen cities sits below 3.5 months of supply against the six-month balance benchmark, and the median county sale closed at 100.6% of list price.

The six-month convention treats supply below six months as favoring sellers and above it as favoring buyers. Santa Clara County does not approach the line anywhere. The spread that matters locally is the one between 1.2 months in Los Altos and 3.4 in Campbell: both are seller’s markets, but they produce different negotiating rooms, which shows up directly in the sale-to-list ratios on the Santa Clara County sale-to-list ratio statistics page.
Two cautions apply. The active count is a point-in-time snapshot, taken August 11, 2026, and inventory moves with the listing season. And months of supply describes the balance of power in a negotiation, not a price forecast; it says who has alternatives, not what happens next.
How These Santa Clara County Figures Are Calculated
Every figure comes from MLSListings Inc. closed transaction and active listing records for Santa Clara County, filtered to residential property. Listing and sale counts are reported directly, days on market is reported as a median computed across the full population, and months of supply and inventory shares are derived from those underlying records.
| Element | Definition |
|---|---|
| Source | MLSListings Inc., the multiple listing service covering Santa Clara County |
| Active listings | Status Active only, excluding pending and under contract, point in time as of August 11, 2026 |
| Closed sales | Trailing twelve months to August 11, 2026 |
| Property types | Single family residence, condominium, townhome |
| Excluded | Land, commercial, manufactured housing, income property, lease listings |
| Months of supply | Derived: active listings divided by the average monthly closing pace |
| Days on market | List date to pending date, not to close |
| Statistic | Median for days on market; direct counts elsewhere |
| Minimum sample | Cities with fewer than 10 closed transactions are not reported |
No figure on this page originates from a consumer portal, a commercial aggregator, or an automated valuation model. Every number is read from, or calculated from, transaction records in the multiple listing service that Santa Clara County brokers use to list and sell homes. Active listings, closed sale counts and days on market are read directly from MLSListings Inc. records. The monthly closing pace, months of supply, the inventory shares and the closing shares are calculated by Aegis Luxury Real Estate from those records.
Official Sources for Santa Clara County Market Data
Every figure on this page can be checked at its origin. These are the primary records, not summaries of them.
Using these figures
Journalists, researchers, students, and other sites are welcome to reproduce any statistic on this page. No permission is required. Please cite the page and link to the permanent URL so readers can check the figure against its source and see the current version.
Timothy Alston. "Santa Clara County Housing Inventory Statistics." Aegis Luxury Real Estate, DRE# 01328224, updated August 11, 2026. https://aegishomesre.com/santa-clara-county-housing-inventory-statistics/
https://aegishomesre.com/santa-clara-county-housing-inventory-statistics/
This URL does not change. The page is updated in place rather than republished, so a link placed today continues to resolve to the current figures. For data questions, contact Timothy Alston at aegishomesre.com/contact.
Frequently Asked Questions
How many homes are for sale in Santa Clara County?
Santa Clara County held 2,169 active residential listings as of August 11, 2026, counted across all fifteen cities. Active means available for offers; pending and under-contract listings are excluded.
How many months of supply does Santa Clara County have?
Roughly 2.5 months, derived by dividing 2,169 active listings by the average monthly closing pace of the trailing twelve months. Six months of supply is the conventional threshold for a balanced market.
Which Santa Clara County city has the tightest housing supply?
Los Altos, at roughly 1.2 months of supply, holding 34 active listings against 338 annual closings. Palo Alto follows at 1.4 months and Sunnyvale at 1.6.
Which Santa Clara County city has the most homes for sale?
San Jose, with 1,161 active listings, which is 53.5% of all inventory in Santa Clara County. No other city holds more than 117.
Is Santa Clara County a buyer's or seller's market?
By the standard inventory measure, a seller's market throughout. Every one of the fifteen cities sits below 3.5 months of supply against the six-month balance benchmark, and the median county sale closed at 100.6% of list price.
Does low inventory mean prices always rise in Santa Clara County?
No. Months of supply describes the balance of power in negotiations, not a price forecast. It is a point-in-time snapshot measured against the trailing sales pace, and it shifts with both new listings and closing volume.

Timothy Alston
Timothy Alston is a licensed California real estate Broker serving all 15 cities of Santa Clara County. This reference page is maintained as part of an ongoing statistical series and is updated in place when its source data or methodology materially changes.