Santa Clara County Aging in Place Statistics

The Santa Clara County median age is 38.1 years, ranking 36th of California's 58 counties, so thirty five counties are older. Across California, county age and owner occupied housing share of population move together tightly, with a correlation of 0.70. Santa Clara County breaks the pattern: it is younger than most of the state and owns at a lower rate than almost all of it.
Key Santa Clara County Aging and Housing Statistics
Census Bureau ACS data- The Santa Clara County median age is 38.1 years. (Census Bureau, ACS)
- That ranks 36th of California's 58 counties, with 35 counties older. (Census Bureau, ACS)
- The California county median of median ages is 39.8, so Santa Clara County runs 1.7 years younger. (Census Bureau, ACS)
- Santa Clara County aged from 37.9 to 38.1 between the 2023 and 2024 estimates. (Census Bureau, ACS)
- 38 of California's 58 counties aged over the same period. (Census Bureau, ACS)
- Trinity County is California's oldest at a median age of 54.9. (Census Bureau, ACS)
- Merced County is the youngest at 31.8. (Census Bureau, ACS)
- Across all 58 California counties, median age and owner occupied housing share of population correlate at 0.70. (Census Bureau, ACS)
- San Mateo County is the oldest of the four at 40.9; Monterey the youngest at 35.5. (Census Bureau, ACS)
What Is the Median Age in Santa Clara County?
The Santa Clara County median age is 38.1 years, from the Census Bureau American Community Survey five year estimate ending 2024. That ranks Santa Clara County 36th of California's 58 counties by age, meaning 35 California counties are older, and places it 1.7 years below the 39.8 year county median.
The county aged 0.2 years between the last two estimates, in line with a state where 38 of 58 counties aged over the same period. The table below sets the Santa Clara County figure against the California county median and against the prior estimate.
| Measure | Value | Detail |
|---|---|---|
| Median age | 38.1 years | ACS five year estimate ending 2024 |
| Rank in California | 36 of 58 | 1 is the oldest county |
| California county median | 39.8 years | Santa Clara County is 1.7 years younger |
| Prior estimate | 37.9 years | Estimate ending 2023 |
| Owner occupied housing share of population | 57.8% | 48th of 58 California counties; ACS B25008 population based measure |
Source: Census Bureau, American Community Survey five year estimates, table B01002, ending 2024.
Do Older Counties Own More Homes?
Measure note: Throughout this section, the 57.8% tenure figure is population based from ACS table B25008: population in owner occupied housing units divided by population in all occupied housing units. It is not the conventional household based homeownership rate.
Yes, strongly. Across all 58 California counties the correlation between median age and owner occupied housing share of population is 0.70. Older California counties own at higher rates and younger ones own at lower rates. Santa Clara County is the clear exception: younger than most of California, it also ranks 48th of 58 on ownership.
The relationship is one of the tightest in California county data. Trinity County, the oldest at 54.9, owns at 68.9%. Merced, the youngest at 31.8, owns at 55.6%. The county level data show a strong association between median age and ownership across California, but they do not establish why the relationship exists. Income, housing costs, household formation and length of tenure may all contribute.
Santa Clara County sits off that line, owning at 57.8%. A county that young would be expected to own at a middling rate rather than near the bottom. Santa Clara County falls below the ownership level the statewide age relationship would suggest. This page does not establish the cause. High housing costs are one plausible factor and would require separate analysis. The Census Bureau records tenure but not the reason a household rents.
How Does Santa Clara County Compare to Its Neighbors?
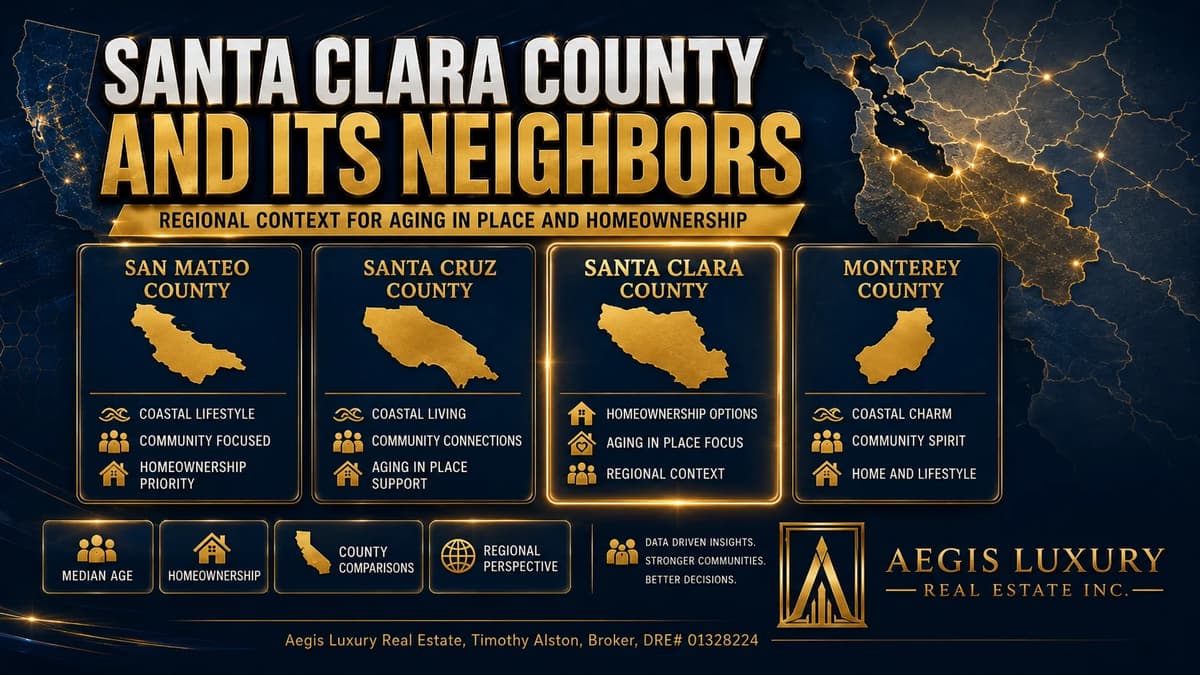
San Mateo County is the oldest of the four at 40.9 years, followed by Santa Cruz County at 39.8, Santa Clara County at 38.1 and Monterey County at 35.5. The owner occupied housing share of population falls in the same order across all four counties, and all four aged between the two most recent Census Bureau estimates.
| County | Median age 2024 | Median age 2023 | Age rank | Owner occupied population share |
|---|---|---|---|---|
| San Mateo County | 40.9 | 40.6 | 21 of 58 | 61.1% |
| Santa Cruz County | 39.8 | 39.6 | 29 of 58 | 59.9% |
| Santa Clara County | 38.1 | 37.9 | 36 of 58 | 57.8% |
| Monterey County | 35.5 | 35.3 | 45 of 58 | 49.7% |
Source: Census Bureau, ACS five year estimates. Age rank of 1 is the oldest of California's 58 counties.
Which California Counties Are Oldest and Youngest?
Trinity County is the oldest California county at a median age of 54.9 years and Merced County the youngest at 31.8, a spread of 23 years across the state. Eight of the ten oldest California counties own at above 70%, while the highest rate among the ten youngest is 67.0% in Yuba County.
| Rank | County | Median age | Owner occupied population share |
|---|---|---|---|
| 1 | Trinity County | 54.9 | 68.9% |
| 2 | Sierra County | 54.7 | 78.6% |
| 3 | Calaveras County | 52.0 | 82.7% |
| 4 | Plumas County | 52.0 | 71.9% |
| 5 | Mariposa County | 51.2 | 75.6% |
| 6 | Nevada County | 50.1 | 76.6% |
| 7 | Amador County | 49.7 | 81.5% |
| 8 | Tuolumne County | 48.4 | 76.0% |
| 9 | Modoc County | 47.5 | 77.3% |
| 10 | Marin County | 47.4 | 66.0% |
| Rank | County | Median age | Owner occupied population share |
|---|---|---|---|
| 49 | Madera County | 34.6 | 63.8% |
| 50 | Santa Barbara County | 34.6 | 51.8% |
| 51 | Yuba County | 34.2 | 67.0% |
| 52 | Fresno County | 33.5 | 56.8% |
| 53 | Imperial County | 33.2 | 58.1% |
| 54 | Kern County | 32.7 | 60.8% |
| 55 | Kings County | 32.5 | 57.0% |
| 56 | Tulare County | 32.1 | 58.1% |
| 57 | Yolo County | 32.1 | 56.1% |
| 58 | Merced County | 31.8 | 55.6% |
Source: Census Bureau, ACS five year estimates ending 2024, all 58 California counties on one methodology.
How These Santa Clara County Figures Are Calculated
Median age for Santa Clara County and every California county comes from Census Bureau American Community Survey five year estimates, table B01002. The tenure measure comes from table B25008 and represents the share of residents in occupied housing units who live in owner occupied housing, not the conventional household based homeownership rate. Ranks, the California county median and the correlation are computed by Aegis Luxury Real Estate across all 58 California counties, and each calculation is stated below.
| Element | Definition |
|---|---|
| Source | United States Census Bureau, American Community Survey five year estimates |
| Age table | B01002, median age by sex |
| Tenure table | B25008, population in occupied units by tenure |
| Period | Each estimate covers sixty months ending in the year shown |
| Ranks | Computed by Aegis across all 58 California counties, 1 is oldest |
| County median | Median of the 58 county median ages, not a population weighted state figure |
| Correlation | Derived: Pearson correlation of county median age against county owner occupied housing share of population, n equals 58 |
| Correlation caution | An association across counties is not a statement about individual households and does not establish cause |
No figure on this page originates from a consumer portal or a commercial aggregator. Every number is read from the Census Bureau release or computed from it, and each computation is stated above.
The Fifteen Cities of Santa Clara County
The Census Bureau publishes median age and housing tenure for Santa Clara County as a whole, so every figure on this page describes the county and not any individual city within it. No city level age or tenure estimate is claimed here. The links below go to listings and current market conditions in each of the fifteen Santa Clara County cities rather than to city level age data.
Official Sources
Every figure on this page can be checked at its origin. These are the primary records, not summaries of them.
Using these figures
Journalists, researchers, students, and other sites are welcome to reproduce any statistic on this page. No permission is required. Please cite the page and link to the permanent URL so readers can check the figure against its source and see the current version.
Timothy Alston. "Santa Clara County Aging in Place Statistics." Aegis Luxury Real Estate, DRE# 01328224, updated August 17, 2026. https://aegishomesre.com/santa-clara-county-aging-in-place-statistics/
https://aegishomesre.com/santa-clara-county-aging-in-place-statistics/
This URL does not change. The page is updated in place rather than republished, so a link placed today continues to resolve to the current figures. For data questions, contact Timothy Alston at aegishomesre.com/contact.
Frequently Asked Questions
What is the median age in Santa Clara County?
The Santa Clara County median age is 38.1 years, from the Census Bureau American Community Survey five year estimate ending 2024. That ranks 36th of California's 58 counties, meaning 35 counties are older.
Is Santa Clara County getting older?
Slightly. The median age rose from 37.9 to 38.1 between the 2023 and 2024 estimates. Statewide 38 of California's 58 counties aged over the same period.
Which California county is the oldest?
Trinity County, at a median age of 54.9 years, followed by Sierra at 54.7, Calaveras and Plumas at 52.0 and Mariposa at 51.2. All five are rural inland counties.
Which California county is the youngest?
Merced County, at a median age of 31.8 years, followed by Tulare and Yolo at 32.1 and Kings at 32.5. These are Central Valley agricultural and university counties.
Do older California counties have a higher owner occupied housing share?
Strongly, yes. Across all 58 California counties the correlation between median age and the owner occupied housing share of population is 0.70. Eight of the ten oldest California counties own at above 70%, while the highest rate among the ten youngest is 67.0% in Yuba County. The correlation describes an association across counties and does not establish a cause. Santa Clara County runs the other way: younger than most of California and also owning less.
How does age in Santa Clara County compare to its neighbors?
San Mateo County is the oldest of the four at a median age of 40.9, followed by Santa Cruz at 39.8, Santa Clara at 38.1 and Monterey at 35.5.

Timothy Alston
Timothy Alston is a licensed California real estate Broker serving all 15 cities of Santa Clara County. This reference page is maintained as part of an ongoing statistical series and is updated in place when its source data or methodology materially changes.