Santa Clara County Homeownership Statistics
The share of Santa Clara County residents living in owner occupied homes is 57.8%, which ranks 48th of California's 58 counties. Forty seven California counties have a higher rate. The county sits roughly 5.7 points below the statewide county median of 63.5%, and the rate has slipped in every estimate since its 58.3% peak in 2021.
Key Santa Clara County Homeownership Statistics
Census Bureau ACS data- The share of Santa Clara County residents living in owner occupied homes is 57.8%. (Census Bureau, ACS)
- Santa Clara County ranks 48th of California's 58 counties. (Census Bureau, ACS)
- 47 California counties have a higher owner occupied housing share than Santa Clara County. (Census Bureau, ACS)
- The California county median is 63.5%, putting Santa Clara County 5.7 points below the typical county. (Census Bureau, ACS)
- San Mateo County is the highest of the four neighboring counties at 61.1%. (Census Bureau, ACS)
- Monterey County is second lowest in California at 49.7%, one of only three counties under 50%. (Census Bureau, ACS)
- San Francisco has California's lowest owner occupied housing share at 44.3%. (Census Bureau, ACS)
- Calaveras County has California's highest at 82.7%. (Census Bureau, ACS)
- Santa Clara County homeownership peaked at 58.3% in 2021 and has fallen in every estimate since. (Census Bureau, ACS)
- Statewide the direction was opposite: 42 of 58 California counties rose between the 2023 and 2024 estimates. (Census Bureau, ACS)
What Share of Santa Clara County Residents Live in Owner Occupied Homes?
The share of Santa Clara County residents living in owner occupied homes is 57.8%, from the Census Bureau American Community Survey five year estimate ending 2024. The 0.5 point slide from the 2021 peak is smaller than the 5.7 point gap to the California county median, so the county position is set by its level rather than its trend.
That figure places Santa Clara County 48th among California's 58 counties. Only ten counties in the state have a lower rate, and they concentrate in large urban counties and in agricultural counties of the Central Valley and the central coast. Santa Clara County is a high income county with a low ownership rate, a combination that is unusual nationally and characteristic of the Bay Area.
| Measure | Value | Detail |
|---|---|---|
| Owner occupied housing share | 57.8% | ACS five year estimate ending 2024 |
| Rank in California | 48 of 58 | 47 counties rank higher |
| California county median | 63.5% | Santa Clara County is 5.7 points below |
| Five year peak | 58.3% | 2021 estimate |
| Change from peak | 0.5 points | Declined in each estimate since 2021 |
Source: United States Census Bureau, American Community Survey five year estimates, table B25008, released January 2026.
How Does Santa Clara County Compare to Neighboring Counties?
San Mateo County has the highest owner occupied housing share of the four at 61.1%, followed by Santa Cruz at 59.9%, Santa Clara at 57.8% and Monterey at 49.7%.
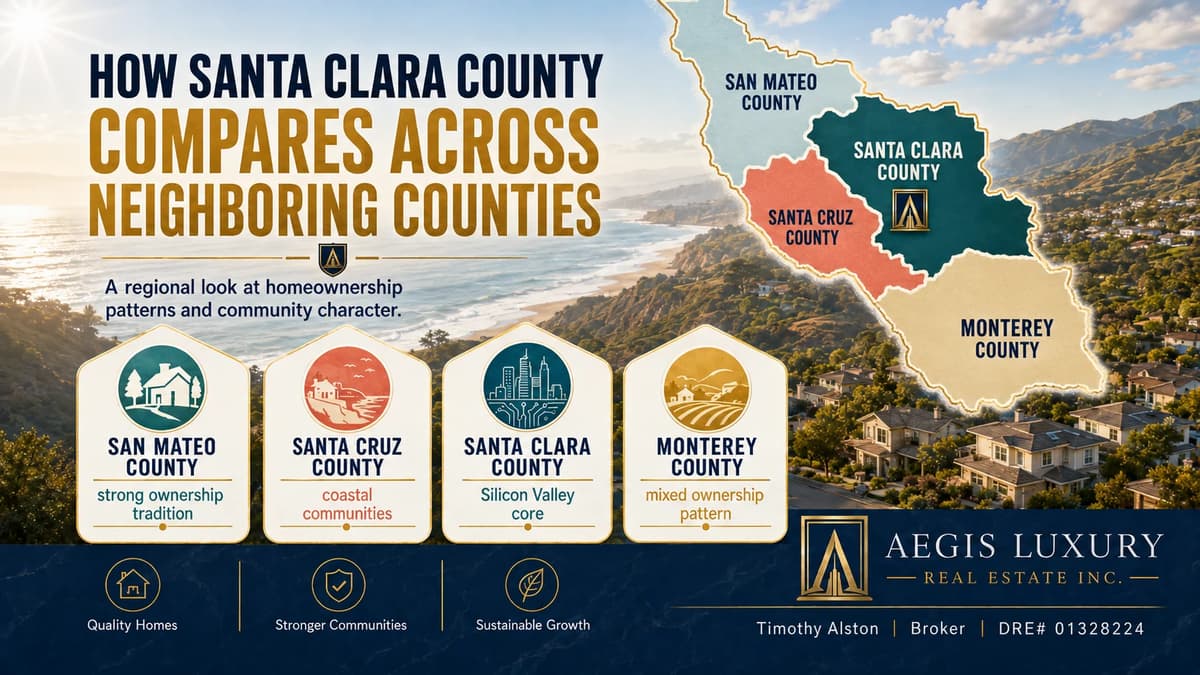
The spread across four adjacent counties is 11.4 points. Monterey County is the second lowest in the entire state, behind only San Francisco, and is one of just three California counties below 50%. San Mateo County, despite carrying higher median home prices than Santa Clara County, has the higher ownership rate of the two.
| County | 2024 estimate | 2023 estimate | California rank |
|---|---|---|---|
| San Mateo County | 61.1% | 61.5% | 38 of 58 |
| Santa Cruz County | 59.9% | 59.8% | 43 of 58 |
| Santa Clara County | 57.8% | 57.9% | 48 of 58 |
| Monterey County | 49.7% | 49.6% | 57 of 58 |
Source: Census Bureau, ACS five year estimates. Market statistics for these counties appear on the Santa Clara County market statistics hub page.
Where Does Santa Clara County Rank in the Bay Area?
Eighth of the nine Bay Area counties. Only San Francisco, at 44.3%, has a lower owner occupied housing share than Santa Clara County. Santa Clara County and Alameda County are separated by 0.1 points, so the eighth place ranking rests on a gap smaller than the rounding on either figure.
The Bay Area splits cleanly. The outer ring counties, Contra Costa at 69.0% and Marin at 66.0%, own at rates near the state median. The inner employment corridor counties, Santa Clara, Alameda and San Francisco, sit at the bottom of the state. Job density and housing scarcity push the same direction on tenure.
| County | Owner occupied share | California rank |
|---|---|---|
| Contra Costa County | 69.0% | 17 of 58 |
| Marin County | 66.0% | 25 of 58 |
| Solano County | 63.9% | 27 of 58 |
| Napa County | 63.4% | 30 of 58 |
| Sonoma County | 63.1% | 32 of 58 |
| San Mateo County | 61.1% | 38 of 58 |
| Alameda County | 57.9% | 47 of 58 |
| Santa Clara County | 57.8% | 48 of 58 |
| San Francisco County | 44.3% | 58 of 58 |
Source: Census Bureau, ACS five year estimates ending 2024.
Which California Counties Own and Which Rent?
Calaveras County leads California at 82.7% and San Francisco sits last at 44.3%, a spread of 38.4 points across the state.
The pattern is not about wealth. The ten highest ownership counties are rural, inland and foothill counties with low populations and low housing costs. The ten lowest are the state's urban employment centers, plus agricultural counties in the Central Valley and along the central coast. Santa Clara County belongs to the urban group despite being one of California's highest income counties.
| Rank | County | Owner occupied share |
|---|---|---|
| 1 | Calaveras County | 82.7% |
| 2 | Amador County | 81.5% |
| 3 | El Dorado County | 78.8% |
| 4 | Sierra County | 78.6% |
| 5 | Alpine County | 77.5% |
| 6 | Modoc County | 77.3% |
| 7 | Placer County | 77.0% |
| 8 | Nevada County | 76.6% |
| 9 | Tuolumne County | 76.0% |
| 10 | Mariposa County | 75.6% |
| Rank | County | Owner occupied share |
|---|---|---|
| 49 | Kings County | 57.0% |
| 50 | Orange County | 56.9% |
| 51 | Fresno County | 56.8% |
| 52 | San Diego County | 56.7% |
| 53 | Yolo County | 56.1% |
| 54 | Merced County | 55.6% |
| 55 | Santa Barbara County | 51.8% |
| 56 | Los Angeles County | 49.7% |
| 57 | Monterey County | 49.7% |
| 58 | San Francisco County | 44.3% |
Source: Census Bureau, ACS five year estimates ending 2024, all 58 California counties on one methodology.
Is Homeownership Rising or Falling in Santa Clara County?
Falling slightly. Santa Clara County peaked at 58.3% in the 2021 estimate and has declined in every estimate since, reaching 57.8% in 2024.

The move is small, 0.5 points across three years, and it runs against the state. Between the 2023 and 2024 estimates 42 of California's 58 counties rose while Santa Clara County fell. One caution on reading the series: consecutive five year estimates share four years of sample data, so year over year comparisons of overlapping periods should be treated as directional rather than precise.
| Estimate ending | Owner occupied share |
|---|---|
| 2020 | 58.1% |
| 2021 | 58.3% |
| 2022 | 58.1% |
| 2023 | 57.9% |
| 2024 | 57.8% |
Source: Census Bureau, ACS five year estimates. Each value covers the sixty months ending in the year shown.
How These Santa Clara County Figures Are Calculated
Every figure comes from United States Census Bureau American Community Survey five year estimates, table B25008. The measure divides the population living in owner occupied housing units by the total population living in occupied housing units. It is a population based share, not the household based homeownership rate, which divides owner occupied households by total households and produces a different figure for the same county and period. Ranks and the county median are computed across all 58 California counties on that single methodology.
| Element | Definition |
|---|---|
| Source | United States Census Bureau, American Community Survey five year estimates |
| Table | B25008, population in occupied housing units by tenure |
| Calculation | Population in owner occupied units divided by total population in occupied units |
| Period | Each estimate covers sixty months ending in the year shown |
| Latest estimate | Five year period ending 2024, released January 2026 |
| Owner occupied | The owner or co-owner lives in the unit, whether or not it carries a mortgage |
| Ranks | Computed by Aegis across all 58 California counties from the same release |
| County median | Median of the 58 county rates, not a population weighted state figure |
| Overlap caution | Consecutive five year estimates share four years of sample; year over year change is directional |
Published homeownership rates for Santa Clara County differ depending on the denominator. The population based measure used here, from table B25008, produces 57.8 percent. Household based measures, which divide owner occupied households by total households, produce a lower figure for the same county and the same period. Neither is wrong. A comparison is only valid when both sides use the same denominator, and every figure on this page uses the population based measure.
No figure on this page originates from a consumer portal, a commercial aggregator, or an automated valuation model. Every number is read from the Census Bureau release or computed from it, and the computation is stated above.
Santa Clara County Market Data by City
The Census Bureau publishes this tenure series at county level. Aegis Luxury Real Estate does not break the owner occupied housing share down to city or neighborhood, and no figure on this page describes any city, neighborhood, or individual property. For current listings, median sale prices, and local market conditions in each Santa Clara County city that Aegis Luxury Real Estate serves, see the individual city pages below.
Official Sources for Santa Clara County Housing Data
Every figure on this page can be checked at its origin. These are the primary records, not summaries of them.
Using these figures
Journalists, researchers, students, and other sites are welcome to reproduce any statistic on this page. No permission is required. Please cite the page and link to the permanent URL so readers can check the figure against its source and see the current version.
Timothy Alston. "Santa Clara County Homeownership Statistics." Aegis Luxury Real Estate, DRE# 01328224, updated August 12, 2026. https://aegishomesre.com/santa-clara-county-homeownership-statistics/
https://aegishomesre.com/santa-clara-county-homeownership-statistics/
This URL does not change. The page is updated in place rather than republished, so a link placed today continues to resolve to the current figures. For data questions, contact Timothy Alston at aegishomesre.com/contact.
Frequently Asked Questions
What share of Santa Clara County residents live in owner occupied homes?
The share of Santa Clara County residents living in owner occupied homes is 57.8 percent, measured by the Census Bureau American Community Survey five year estimate ending 2024. The measure divides the population living in owner occupied housing units by the total population living in occupied housing units, using ACS table B25008.
How does Santa Clara County homeownership compare to other California counties?
Santa Clara County ranks 48th of California's 58 counties. Forty seven counties have a higher owner occupied housing share. The statewide county median is 63.5 percent, so Santa Clara County sits roughly six points below the typical California county.
Which California county has the lowest owner occupied housing share?
San Francisco, at 44.3 percent. Monterey County follows at 49.7 percent and Los Angeles County at 49.7 percent. These are the only three California counties below 50 percent.
Which California county has the highest owner occupied housing share?
Calaveras County, at 82.7 percent. Amador County follows at 81.5 percent. The highest rates are concentrated in rural inland and foothill counties rather than coastal metropolitan areas.
Is homeownership rising or falling in Santa Clara County?
Falling slightly. The Santa Clara County rate peaked at 58.3 percent in 2021 and has declined in each subsequent estimate to 57.8 percent in 2024, a drop of 0.5 percentage points. Statewide the pattern ran the other way: 42 of 58 California counties rose between the 2023 and 2024 estimates.
Why is the Santa Clara County owner occupied housing share lower than the national figure?
Definitions differ and so do denominators. The figure on this page is population based, from ACS table B25008. Household based measures, which divide owner occupied households by total households, produce a different and generally lower number for the same county. Any comparison must use the same denominator on both sides.

Timothy Alston
Timothy Alston is a licensed California real estate Broker serving all 15 cities of Santa Clara County. This reference page is maintained as part of an ongoing statistical series and is updated in place when its source data or methodology materially changes.