Santa Clara County Housing Construction Permit Statistics
Santa Clara County authorized 5,323 new private housing structures in 2025, up 38.8% from 3,834 in 2024. Permit volume in the county is volatile rather than trending: it peaked at 7,853 in 2022, fell for two straight years, then rebounded. Santa Clara County still permits fewer new structures than Sacramento County, both in raw count and at 20.0 structures per 10,000 residents against Sacramento County's 42.0. The county authorized roughly one new structure per 361 residents in 2025. A structure is a permitted building, not a housing unit, so 5,323 counts buildings authorized rather than homes delivered.
Key Santa Clara County Construction Permit Statistics
Census Bureau Building Permits Survey- Santa Clara County authorized 5,323 new private housing structures in 2025. (Census Bureau)
- That is up 38.8% from 3,834 in 2024. (Census Bureau)
- The six year peak was 7,853 structures in 2022. (Census Bureau)
- The six year trough was 3,834 in 2024, roughly half the 2022 peak. (Census Bureau)
- Permits fell in two consecutive years, 2023 and 2024, before rebounding. (Census Bureau)
- Sacramento County authorized 6,747 structures in 2024 against Santa Clara County's 3,834. (Census Bureau)
- Los Angeles County authorized 19,809 in 2024, more than five times Santa Clara County. (Census Bureau)
- San Francisco authorized only 770 structures in 2024, down 32.2% from 2023. (Census Bureau)
- Santa Clara County authorized roughly one new structure per 361 residents in 2025, or 27.6 per 10,000. (Aegis calculation, Census Bureau and California Department of Finance)
- In 2024 the county authorized 20.0 structures per 10,000 residents against Sacramento County's 42.0, a rate 2.1 times higher. (Aegis calculation, Census Bureau and California Department of Finance)
How Many New Homes Are Permitted in Santa Clara County?
Santa Clara County authorized 5,323 new private housing structures in 2025, from the United States Census Bureau Building Permits Survey. That is roughly one new structure per 361 residents. A structure is a permitted building, not a housing unit, so 5,323 counts buildings authorized rather than homes delivered. The 2025 total is 34 fewer than the 5,357 authorized in 2020, leaving six years of permitting effectively flat.
A single apartment building counts once regardless of how many homes it contains, which means the series measures construction activity rather than units. Santa Clara County authorized 27.6 structures per 10,000 residents in 2025 against a July 2025 county population of 1,926,809.
Is Home Construction Rising or Falling in Santa Clara County?
Neither. It is volatile. Permits ran 5,357 in 2020, fell to 4,044 in 2021, peaked at 7,853 in 2022, fell two straight years to 3,834 in 2024, then rebounded 38.8% to 5,323 in 2025.

The 2022 peak is roughly double the 2024 trough, inside three years. A single large multifamily approval can move a county level count materially, which is why the series should be read across several years rather than one.
| Year | Structures authorized | Change from prior year |
|---|---|---|
| 2020 | 5,357 | |
| 2021 | 4,044 | -24.5% |
| 2022 | 7,853 | +94.2% |
| 2023 | 5,834 | -25.7% |
| 2024 | 3,834 | -34.3% |
| 2025 | 5,323 | +38.8% |
Source: United States Census Bureau, Building Permits Survey, annual series through 2025.
How Does Santa Clara County Compare to Other California Counties?
Santa Clara County authorized 3,834 structures in 2024, fewer than Sacramento County at 6,747 and far fewer than Los Angeles County at 19,809. Sacramento authorized 2,913 more structures than Santa Clara County that year, a gap larger than San Francisco County entire annual total.
Sacramento County has a smaller population and materially lower home prices, yet authorized 76% more new structures than Santa Clara County in the same year. San Francisco, the most constrained county in the region, authorized 770.
| County | 2024 | 2023 | Change |
|---|---|---|---|
| Los Angeles County | 19,809 | 24,286 | -18.4% |
| Sacramento County | 6,747 | 6,930 | -2.6% |
| Santa Clara County market statistics hub | 3,834 | 5,834 | -34.3% |
| San Francisco County | 770 | 1,136 | -32.2% |
Source: Census Bureau, Building Permits Survey. Counties shown are those with a verified annual series at the time of this update.
How Much Does Santa Clara County Permit Per Resident?
Santa Clara County authorized 20.0 new private housing structures per 10,000 residents in 2024, the same rate as Los Angeles County and less than half Sacramento County's 42.0. San Francisco County authorized 9.2 per 10,000 residents.
Raw permit counts favor large counties. Dividing authorized structures by population puts the four counties on one scale and changes the reading of the comparison above. Santa Clara County does not permit at a low rate because it is small. It permits at almost exactly the rate of Los Angeles County, a county five times its size, while Sacramento County permits at more than double the Santa Clara County rate.
| County | Structures authorized 2024 | Population July 1, 2024 | Per 10,000 residents |
|---|---|---|---|
| Sacramento County | 6,747 | 1,605,188 | 42.0 |
| Los Angeles County | 19,809 | 9,898,257 | 20.0 |
| Santa Clara County | 3,834 | 1,921,212 | 20.0 |
| San Francisco County | 770 | 840,440 | 9.2 |
Sources: Permit counts from the United States Census Bureau Building Permits Survey. Population from California Department of Finance report E-2, revised July 1, 2024 county estimates, February 2026 release. Rates calculated by Aegis Luxury Real Estate as structures authorized divided by population, multiplied by 10,000.
Sacramento County permitted new housing structures at 2.1 times the Santa Clara County rate per resident in 2024, with a smaller population and materially lower home prices. On the same measure Santa Clara County and Los Angeles County are indistinguishable at 20.0 structures per 10,000 residents each. Santa Clara County's 2025 rebound lifted its own rate to 27.6 per 10,000 residents, still below the Sacramento County 2024 figure.
What Do Permits Mean for Future Supply in Santa Clara County?
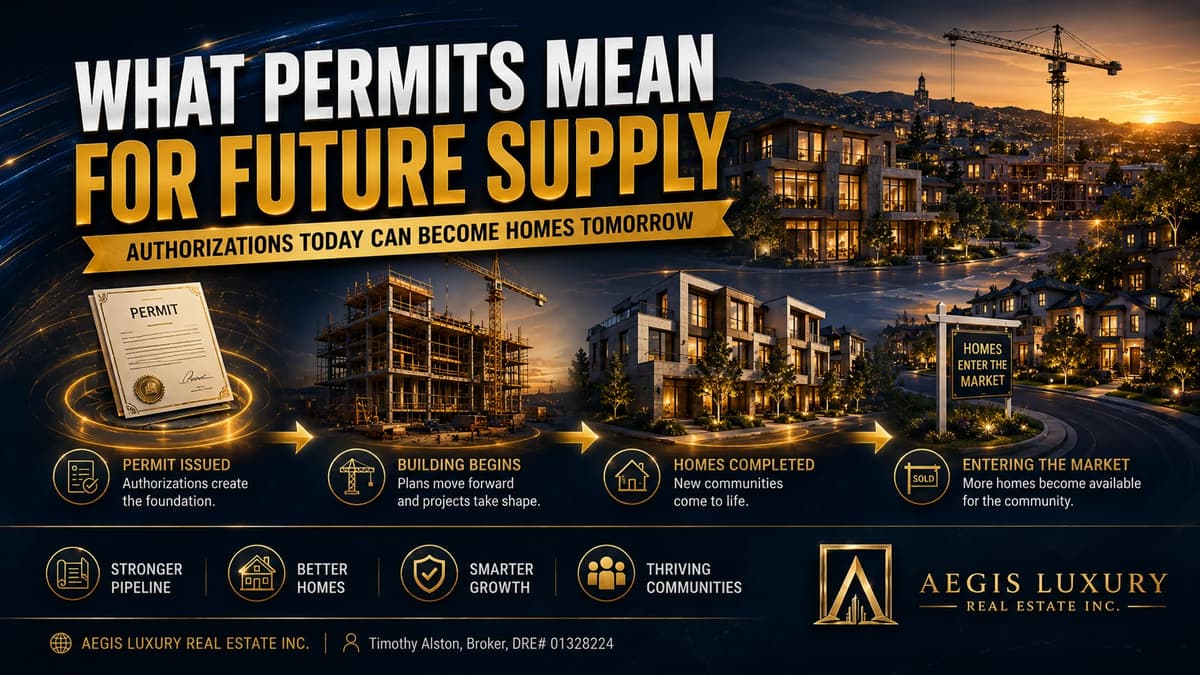
Permits are a leading indicator of Santa Clara County housing supply. A structure authorized today is typically completed one to three years later, so these counts describe supply that reaches the market after the current cycle rather than what is available to buy now. Some authorized projects are delayed, revised in scope, or never built at all.
Santa Clara County currently holds roughly 2.5 months of supply on the MLSListings feed, against a homeownership rate of 57.8% from Census American Community Survey estimates that ranks 48th of California's 58 counties. Permit volume at the levels shown above does not change that balance quickly. The 2024 trough in particular will show up as thinner completions through the back half of this decade.
How These Figures Are Calculated
All permit counts come from the United States Census Bureau Building Permits Survey, read directly from the published annual county series. Percentage changes are derived from those counts.
| Element | Definition |
|---|---|
| Permit source | United States Census Bureau, Building Permits Survey |
| Population source | California Department of Finance report E-2, county population estimates, February 2026 release |
| Homeownership source | United States Census Bureau, American Community Survey five year estimates, tenure |
| Months of supply source | MLSListings Inc. closed and active listing data for Santa Clara County |
| Measure | New private housing structures authorized by building permits |
| Structure, not unit | A permitted building counts once regardless of how many homes it contains |
| Structure types | One unit, two unit, three unit, four unit, and five or more unit buildings |
| Coverage | Permit issuing places only; unpermitted and exempt construction is not counted |
| Frequency | Annual, not seasonally adjusted |
| Latest year | 2025, released May 2026 |
| Percentage change | Derived from the published counts |
| Permit intensity | Structures authorized divided by county population, multiplied by 10,000. Calculated by Aegis Luxury Real Estate |
| Population vintage | Permit year matched to the July 1 estimate for the same year |
| Authorized is not built | A permit is an authorization; typical completion follows one to three years later, some permits lapse, and some are revised in scope |
No figure on this page originates from a consumer portal or a commercial aggregator. Permit counts are read from the Census Bureau release. Population counts are read from the California Department of Finance release. Months of supply is read from the MLSListings Inc. feed. Permit intensity is calculated by Aegis Luxury Real Estate from the two published government series and is stated as such wherever it appears.
Santa Clara County Market Data by City
The United States Census Bureau Building Permits Survey publishes this series at county level. Aegis Luxury Real Estate does not break permit counts down to city or neighborhood, and no figure on this page describes any city, neighborhood, or individual property. For current listings, median sale prices, and local market conditions in each Santa Clara County city that Aegis Luxury Real Estate serves, see the individual city pages below.
Official Sources
Every figure on this page can be checked at its origin. These are the primary records, not summaries of them.
Using these figures
Journalists, researchers, students, and other sites are welcome to reproduce any statistic on this page. No permission is required. Please cite the page and link to the permanent URL so readers can check the figure against its source and see the current version.
Timothy Alston. "Santa Clara County Housing Construction Permit Statistics." Aegis Luxury Real Estate, DRE# 01328224, updated August 16, 2026. https://aegishomesre.com/santa-clara-county-housing-construction-permit-statistics/
https://aegishomesre.com/santa-clara-county-housing-construction-permit-statistics/
This URL does not change. The page is updated in place rather than republished, so a link placed today continues to resolve to the current figures. For data questions, contact Timothy Alston at aegishomesre.com/contact.
Frequently Asked Questions
How many new homes were permitted in Santa Clara County?
Santa Clara County authorized 5,323 new private housing structures in 2025, from the Census Bureau Building Permits Survey. That is up 38.8 percent from 3,834 in 2024. A structure is a permitted building, not a housing unit, so 5,323 counts buildings authorized rather than homes delivered.
Is home construction rising or falling in Santa Clara County?
It is volatile rather than trending. Permits ran 5,357 in 2020, fell to 4,044 in 2021, peaked at 7,853 in 2022, fell two straight years to 3,834 in 2024, then rebounded to 5,323 in 2025. The 2022 peak is roughly double the 2024 trough.
How does Santa Clara County construction compare to other California counties?
In 2024 Los Angeles County authorized 19,809 structures, Sacramento County 6,747, Santa Clara County 3,834 and San Francisco 770. Santa Clara County permits fewer new structures than Sacramento County despite a larger population and far higher home prices.
How much new housing does Santa Clara County permit per resident?
Santa Clara County authorized roughly one new structure per 361 residents in 2025, or 27.6 structures per 10,000 residents, against a July 2025 county population of 1,926,809 from California Department of Finance estimates.
Why does permit volume matter to buyers and sellers?
Permits are a leading indicator of future supply. A structure authorized today is typically completed one to three years later, so permit counts describe supply that reaches the market after the current cycle rather than inventory available now. Some authorized projects are delayed, revised in scope, or never built. Santa Clara County currently holds roughly 2.5 months of supply.
Does Santa Clara County permit less housing than other California counties per resident?
Yes, relative to Sacramento County. In 2024 Santa Clara County authorized 20.0 new private housing structures per 10,000 residents, Los Angeles County 20.0, Sacramento County 42.0 and San Francisco County 9.2. Sacramento County permitted at 2.1 times the Santa Clara County rate per resident.
What counts as a structure in this data?
A structure is a permitted building, which may contain one unit or many. The series counts all structure types including single unit, two to four unit and five or more unit buildings. It is not a count of housing units, so a large apartment building counts once.

Timothy Alston
Timothy Alston is a licensed California real estate Broker serving all 15 cities of Santa Clara County. This reference page is maintained as part of an ongoing statistical series and is updated in place when its source data or methodology materially changes.