Santa Clara County Income Statistics

Per capita personal income in Santa Clara County was $157,620 in 2024, ranking 4th of California's 58 counties and rising 5.5% from the year before. Only four California counties exceed $150,000, and all four are in the Bay Area. The richest county in the state is 4.5x the poorest.
Key Santa Clara County Income Statistics
Bureau of Economic Analysis- Per capita personal income in Santa Clara County was $157,620 in 2024. (Bureau of Economic Analysis)
- That ranks 4th of California's 58 counties. (Bureau of Economic Analysis)
- Income rose 5.5% from $149,429 in 2023. (Bureau of Economic Analysis)
- Marin County leads California at $190,891. (Bureau of Economic Analysis)
- Trinity County is lowest at $42,191, a 4.5x spread across the state. (Bureau of Economic Analysis)
- Only four California counties exceed $150,000, and all four are in the Bay Area. (Bureau of Economic Analysis)
- San Mateo County per capita income is 2.4x Monterey County. (Bureau of Economic Analysis)
- The fastest growing county was Modoc at +12.6%. (Bureau of Economic Analysis)
- Three of California's four highest income counties sit below the state county median owner occupied housing share of 63.5%. (Aegis calculation from Bureau of Economic Analysis and Census Bureau ACS data)
What Is the Per Capita Income in Santa Clara County?
Per capita personal income in Santa Clara County was $157,620 in 2024, ranking 4th of California's 58 counties.
Only Marin at $190,891, San Mateo at $179,656 and San Francisco at $171,497 rank higher. Those four counties are the only ones in California above $150,000, and all four sit in the Bay Area. The fifth ranked county, Alameda, is $46,352 behind Santa Clara.
| Rank | County | Per capita income | Growth from 2023 |
|---|---|---|---|
| 1 | Marin County | $190,891 | +5.7% |
| 2 | San Mateo County | $179,656 | +5.0% |
| 3 | San Francisco County | $171,497 | +5.6% |
| 4 | Santa Clara County | $157,620 | +5.5% |
| 5 | Alameda County | $111,268 | +6.5% |
| 6 | Contra Costa County | $108,259 | +5.9% |
| 7 | Napa County | $103,017 | +7.1% |
| 8 | Orange County | $94,034 | +5.1% |
| 9 | Santa Cruz County | $93,580 | +6.8% |
| 10 | El Dorado County | $89,554 | +5.5% |
Source: Bureau of Economic Analysis, per capita personal income by county, 2024.
How Wide Is the Income Gap Across California?
Marin County at $190,891 is 4.5x Trinity County at $42,191.
The lowest income counties are concentrated in rural inland California, with Del Norte the coastal exception, and every one of the bottom ten sits below $53,100. Santa Clara County per capita income is roughly 3.7x the lowest county in the state.
| Rank | County | Per capita income | Growth from 2023 |
|---|---|---|---|
| 49 | Tulare County | $53,098 | +8.9% |
| 50 | Lake County | $52,606 | +8.9% |
| 51 | Imperial County | $52,117 | +8.0% |
| 52 | Merced County | $51,481 | +10.0% |
| 53 | Madera County | $51,225 | +8.8% |
| 54 | Kern County | $50,641 | +6.7% |
| 55 | Del Norte County | $50,144 | +6.9% |
| 56 | Lassen County | $48,818 | +11.6% |
| 57 | Kings County | $47,718 | +7.6% |
| 58 | Trinity County | $42,191 | +9.6% |
Source: Bureau of Economic Analysis, 2024.
Which California Counties Grew Income Fastest?
Modoc County led California at +12.6% between 2023 and 2024. Santa Clara County grew +5.5%. None of the four counties above $150,000 appears among the ten fastest growing.
| Rank | County | Growth | 2024 income |
|---|---|---|---|
| 1 | Modoc County | +12.6% | $68,353 |
| 2 | Alpine County | +12.3% | $88,146 |
| 3 | Lassen County | +11.6% | $48,818 |
| 4 | Siskiyou County | +11.0% | $61,164 |
| 5 | Humboldt County | +10.4% | $62,031 |
| 6 | Merced County | +10.0% | $51,481 |
| 7 | Plumas County | +9.6% | $71,569 |
| 8 | Trinity County | +9.6% | $42,191 |
| 9 | Tulare County | +8.9% | $53,098 |
| 10 | Lake County | +8.9% | $52,606 |
Source: Bureau of Economic Analysis, 2024 and 2023. Growth is derived from the published levels.
How Does Income Compare Across the Four County Region?
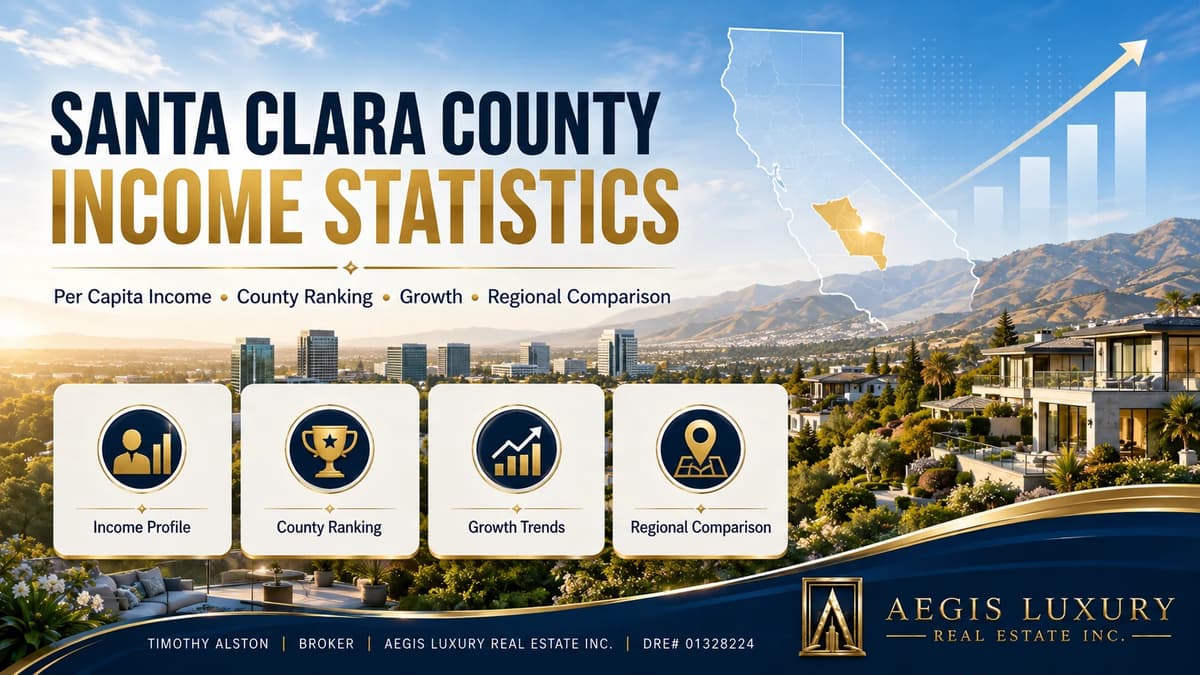
San Mateo County leads the region at $179,656, and Monterey trails at $74,175, a gap of 2.4x.
| County | Per capita income | Income rank | Growth | Owner occupied share |
|---|---|---|---|---|
| San Mateo County | $179,656 | #2 | +5.0% | 61.1% |
| Santa Clara County | $157,620 | #4 | +5.5% | 57.8% |
| Santa Cruz County | $93,580 | #9 | +6.8% | 59.9% |
| Monterey County | $74,175 | #21 | +6.5% | 49.7% |
Source: Income from Bureau of Economic Analysis 2024. Owner occupied housing share from Census Bureau ACS five year estimates ending 2024, table B25008.
How These Figures Are Calculated
All income figures come from the Bureau of Economic Analysis per capita personal income series for counties. Ranks, growth rates and ratios are computed across all 58 California counties from that single release.
| Element | Definition |
|---|---|
| Source | United States Bureau of Economic Analysis, personal income by county |
| Measure | Per capita personal income, total county personal income divided by resident population |
| Includes | Wages, proprietors income, dividends, interest, rent and transfer receipts |
| Population base | All residents including children and people not in the labor force |
| Not household income | Median household income is a different measure and ranks counties differently |
| Year | 2024, the most recent complete county series |
| Derived figures | Ranks, growth rates and county ratios, computed by Aegis from the published levels |
| Owner occupied housing share | Census Bureau ACS table B25008, the share of residents living in owner occupied homes. This is not the household based homeownership rate, which uses a different denominator. Shown for context only |
No figure on this page originates from a consumer portal or a commercial aggregator. Every figure is read from a federal statistical release or computed from one.
Official Sources
Every figure on this page can be checked at its origin. These are the primary records, not summaries of them.
Using these figures
Journalists, researchers, students, and other sites are welcome to reproduce any statistic on this page. No permission is required. Please cite the page and link to the permanent URL so readers can check the figure against its source and see the current version.
Timothy Alston. "Santa Clara County Income Statistics." Aegis Luxury Real Estate, DRE# 01328224, updated August 17, 2026. https://aegishomesre.com/santa-clara-county-income-statistics/
https://aegishomesre.com/santa-clara-county-income-statistics/
This URL does not change. The page is updated in place rather than republished, so a link placed today continues to resolve to the current figures. For data questions, contact Timothy Alston at aegishomesre.com/contact.
Frequently Asked Questions
What is the per capita income in Santa Clara County?
Per capita personal income in Santa Clara County was $157,620 in 2024, from the Bureau of Economic Analysis. That ranks 4th of California's 58 counties.
Which California county has the highest income?
Marin County, at $190,891 per capita in 2024. San Mateo follows at $179,656, San Francisco at $171,497 and Santa Clara at $157,620. These four are the only California counties above $150,000.
Which California county has the lowest income?
Trinity County, at $42,191 per capita. Kings County follows at $47,718 and Lassen at $48,818. The highest California county is 4.5 times the lowest.
How fast is income growing in Santa Clara County?
Per capita personal income rose 5.5 percent between 2023 and 2024, from $149,429 to $157,620. That is slower than the fastest growing county, Modoc at 12.6 percent.
Does high income mean high homeownership in California?
Not uniformly. Santa Clara County ranks 4th for per capita income and 48th of 58 for owner occupied housing share at 57.8 percent. San Francisco ranks 3rd for income and last in the state for owner occupied share at 44.3 percent, and San Mateo ranks 2nd for income at 61.1 percent. All three sit below the California county median of 63.5 percent. Marin is the exception, ranking 1st for income and 66.0 percent for owner occupied share, above the state county median.
Is per capita income the same as household income?
No. Per capita personal income divides total county personal income by total population, including children and people not working. Median household income describes the median household. The two rank counties differently and should never be compared against each other.

Timothy Alston
Timothy Alston is a licensed California real estate Broker serving all 15 cities of Santa Clara County. This reference page is maintained as part of an ongoing statistical series and is updated in place when its source data or methodology materially changes.