Santa Clara County Unemployment Statistics

Santa Clara County recorded 44,080 unemployed persons as a 2025 annual average, up 3.8% from 42,477 the year before. That is 4.1% of California's 1,085,280 total. 57 of the state's 58 counties saw their count rise, with Los Angeles the notable exception.
Key Santa Clara County Unemployment Statistics
Bureau of Labor Statistics- Santa Clara County recorded 44,080 unemployed persons in 2025. (Bureau of Labor Statistics)
- That is up 3.8% from 42,477 in 2024. (Bureau of Labor Statistics)
- Santa Clara County holds 4.1% of California's unemployed persons. (Bureau of Labor Statistics)
- California recorded 1,085,280 unemployed persons in 2025, up 4.1%. (Bureau of Labor Statistics)
- 57 of California's 58 counties saw unemployed persons rise. (Bureau of Labor Statistics)
- Los Angeles County is the largest county to fall, down 2.0%. (Bureau of Labor Statistics)
- Santa Clara County carries more unemployed persons than San Mateo, Santa Cruz and Monterey combined. (Bureau of Labor Statistics)
- San Mateo County recorded 16,128, roughly a third of Santa Clara County. (Bureau of Labor Statistics)
- This is a count of persons, not an unemployment rate. (Bureau of Labor Statistics)
How Many People Are Unemployed in Santa Clara County?
Santa Clara County recorded 44,080 unemployed persons as a 2025 annual average, up 3.8% from 42,477 in 2024, an increase of 1,603 people.
That is 4.1% of California's 1,085,280 unemployed persons. This page reports a count rather than a rate, so it moves with both the number out of work and the size of the labor force.
Is Unemployment Rising in Santa Clara County?
Yes. The county count rose 3.8% between the 2024 and 2025 annual averages, and 57 of California's 58 counties rose over the same period.
California as a whole went from 1,042,152 to 1,085,280 unemployed persons, an increase of 4.1%. The notable exception is Los Angeles County, which fell 2.0% and is the only county among the ten largest to decline.
| Rank | County | Unemployed persons | Change from 2024 |
|---|---|---|---|
| 1 | Los Angeles County | 288,211 | -2.0% |
| 2 | San Diego County | 76,773 | +8.1% |
| 3 | Orange County | 67,829 | +6.7% |
| 4 | Riverside County | 67,049 | +6.3% |
| 5 | San Bernardino County | 56,240 | +6.6% |
| 6 | Santa Clara County | 44,080 | +3.8% |
| 7 | Alameda County | 40,676 | +5.5% |
| 8 | Fresno County | 40,556 | +8.5% |
| 9 | Sacramento County | 39,798 | +8.5% |
| 10 | Kern County | 37,191 | +4.8% |
Source: Bureau of Labor Statistics, Local Area Unemployment Statistics, annual averages, not seasonally adjusted.
How Does Santa Clara County Compare to Its Neighbours?
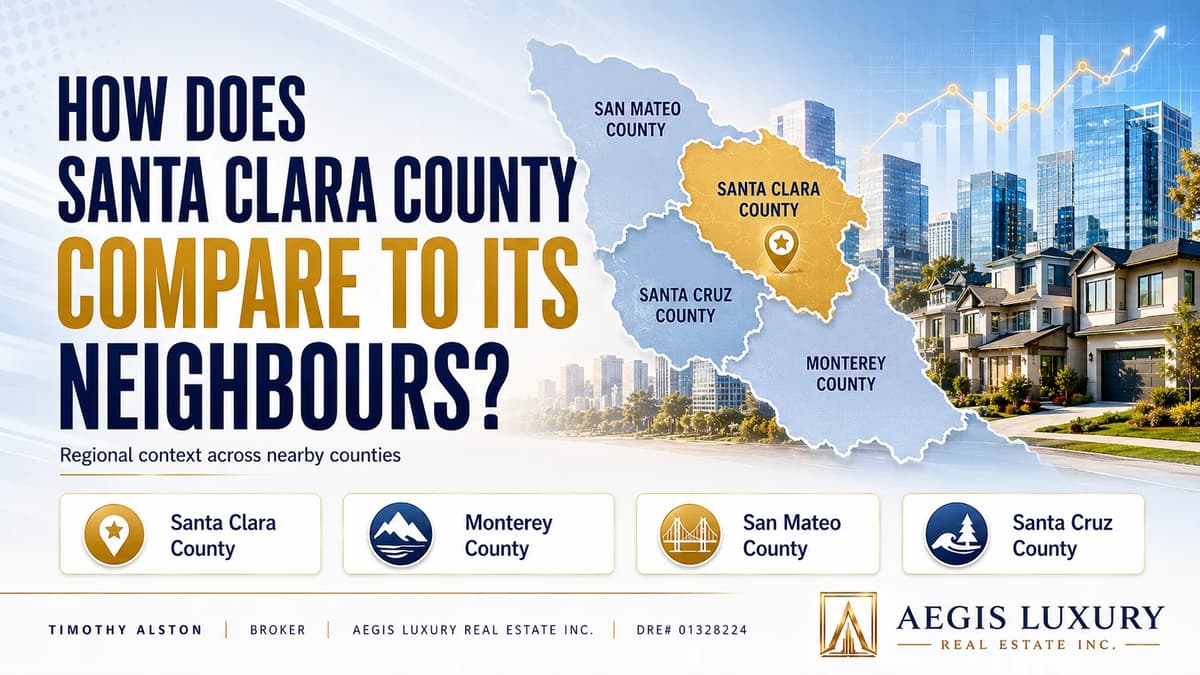
Santa Clara County carries more unemployed persons than the other three counties in the region combined, at 44,080 against 42,410.
| County | 2025 | 2024 | Change |
|---|---|---|---|
| Santa Clara County | 44,080 | 42,477 | +3.8% |
| Monterey County | 17,492 | 16,137 | +8.4% |
| San Mateo County | 16,128 | 15,266 | +5.6% |
| Santa Cruz County | 8,790 | 8,114 | +8.3% |
Source: Bureau of Labor Statistics, Local Area Unemployment Statistics. Counts reflect labor force size as well as joblessness; Santa Clara County has by far the largest labor force of the four.
How These Figures Are Calculated
All counts come from the Bureau of Labor Statistics Local Area Unemployment Statistics program, read directly from the published annual county series. Percentage changes and the state share are derived from those counts.
| Element | Definition |
|---|---|
| Source | United States Bureau of Labor Statistics, Local Area Unemployment Statistics |
| Measure | Unemployed persons, annual average |
| Unemployed defined | No employment during the reference week, available for work, and actively seeking work in the prior four weeks |
| Not a rate | This is a count; the unemployment rate divides it by the civilian labor force |
| Adjustment | Not seasonally adjusted |
| Latest year | 2025 annual average |
| Derived figures | Percentage change and share of the state total |
No figure on this page originates from a consumer portal or a commercial aggregator. Every count is read from the Bureau of Labor Statistics release.
Official Sources
Every figure on this page can be checked at its origin. These are the primary records, not summaries of them.
Using these figures
Journalists, researchers, students, and other sites are welcome to reproduce any statistic on this page. No permission is required. Please cite the page and link to the permanent URL so readers can check the figure against its source and see the current version.
Timothy Alston. "Santa Clara County Unemployment Statistics." Aegis Luxury Real Estate, DRE# 01328224, updated August 12, 2026. https://aegishomesre.com/santa-clara-county-unemployment-statistics/
https://aegishomesre.com/santa-clara-county-unemployment-statistics/
This URL does not change. The page is updated in place rather than republished, so a link placed today continues to resolve to the current figures. For data questions, contact Timothy Alston at aegishomesre.com/contact.
Frequently Asked Questions
How many people are unemployed in Santa Clara County?
Santa Clara County recorded 44,080 unemployed persons in 2025, an annual average from the Bureau of Labor Statistics Local Area Unemployment Statistics program, up 3.8 percent from 42,477 in 2024.
Is unemployment rising in Santa Clara County?
Yes. Unemployed persons rose 3.8 percent between the 2024 and 2025 annual averages. Statewide the count rose from 1,042,152 to 1,085,280, an increase of 4.1 percent, and 57 of California's 58 counties rose.
Which California county has the most unemployed residents?
Los Angeles County, at 288,211 in 2025. It is also the only large county to fall, down 2.0 percent from 2024. Orange County follows at 67,829 and Riverside at 67,049.
How does Santa Clara County compare to its neighbours?
Santa Clara County recorded 44,080 unemployed persons, far more than San Mateo at 16,128, Monterey at 17,492 and Santa Cruz at 8,790, reflecting its much larger labor force.
Why does unemployment matter to the housing market?
Employment underpins mortgage qualification and the depth of the buyer pool. Employment conditions can affect household income, mortgage qualification and the size of the potential buyer pool. This page does not measure or establish a causal relationship between unemployment counts and Santa Clara County home prices, sales volume or housing demand.
Is this a rate or a count?
A count. This page reports unemployed persons, an annual average of the number of people without work who were available for and seeking work. It is not the unemployment rate, which divides that count by the labor force. A county can add unemployed persons while its rate stays flat if the labor force grows at the same pace.

Timothy Alston
Timothy Alston is a licensed California real estate Broker serving all 15 cities of Santa Clara County. This reference page is maintained as part of an ongoing statistical series and is updated in place when its source data or methodology materially changes.